

In the mid-19th century, Paul Broca, a professor of clinical surgery, effectively argued that the degree of
Question:
In the mid-19th century, Paul Broca, a professor of clinical surgery, effectively argued that the degree of a person's intelligence was directly related to the size of the brain.
Arguments regarding brain size diminished in the 20th century as scientists turned to intelligence tests - a more direct method to measure and compare mental capacities, they claimed. However, in a 1978 book designed to acquaint educators with modern brain research, H. T. Epstein declared, "First we shall ask if there is any indication of a linkage of any kind between brain and intelligence. It is generally stated that there is no such linkage.... But the one set of data I have found seems to show clearly that there is a substantial connection. Hooton studied the head circumferences of white Bostonians as part of his massive study of criminals. The following table shows that the ordering of people according to head size yields an entirely plausible ordering according to vocational status. It is not at all clear how the impression has been spread that there is no such correlation."
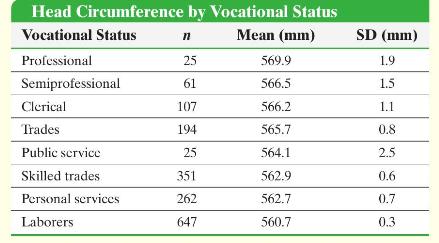
Initially, this table seems to support the assertion that those with more prestigious vocations have a larger head circumference. However, we can examine the alleged relationship more closely through a oneway ANOVA. Specifically, we test the claim that all the head-circumference population means are equal. We use an \(\alpha=0.05\) significance level and obtain the following ANOVA table, derived from Epstein's statistics:
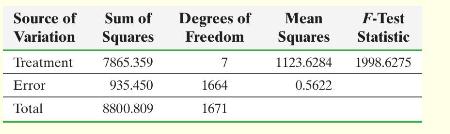
From these results, does it appear that at least one of the head-circumference means is different from the others? Explain.
Examine Epstein's table closely. Does it appear that the ANOVA procedure's requirement of equal variances is satisfied? Explain.
Subsequently, there was an error in Epstein's table. The column labeled SD (standard deviation) should have been labeled standard error. For each vocational category, calculate the correct standard deviation by multiplying the tabled value by the square root of its sample size, \(n\). If the ANOVA table was recalculated with the correct standard deviations, predict the effect on the \(F\)-test statistic. Would you be more or less likely to reject the null hypothesis? Explain.
Using the formula for MSE, calculate a revised sum of squared errors, mean square due to error, and \(F\)-test statistic. Retest the claim that all the head-circumference population means are equal. Use an \(\alpha=0.05\) significance level. From the corrected values for the standard deviation, does it appear that the ANOVA procedure's requirement of equal variances is satisfied? Did any of your conclusions change in light of the new information? Explain.
If the null hypothesis of equal population means was rejected, use Tukey's test to determine which of the pairwise means differ using a familywise error rate of \(\alpha=0.05\). Which of these categories appear to have significantly different means?
Further research revealed that results for three vocational status groups were not presented in Epstein's table: factory workers (rank 7 out of 11 in status), transportation employees (rank 8), and extractive trades (farming and mining, rank 11). These mean headcircumference sizes were \(564.7,564.9\), and \(564.7 \mathrm{~mm}\), respectively. Also, Epstein's table did not list each group in the order of Hooton's prestige ranking but, rather, in order of mean head circumference, suggesting a perfect correlation where one does not exist. (Source: Stephen Jay Gould, The Mismeasure of Man. W. W. Norton \& Company, New York, 1981, p. 110) Using this new information and your previous analyses, write a brief report summarizing your findings and conclusions.
Step by Step Answer:


Statistics Informed Decisions Using Data
ISBN: 9781292157115
5th Global Edition
Authors: Michael Sullivan
