

Question: The data in Table 7 represent the number of licensed drivers in various age groups and the number of fatal accidents within the age group
The data in Table 7 represent the number of licensed drivers in various age groups and the number of fatal accidents within the age group by gender.
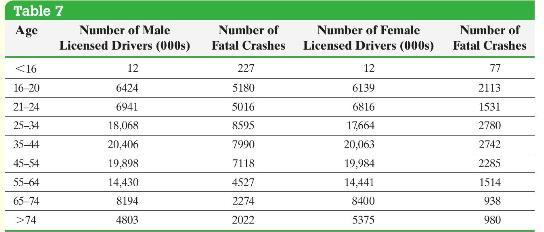
(a) Draw a scatter diagram of the data treating number of licensed drivers as the explanatory variable and number of fatal crashes as the response variable using a different plotting symbol for each gender.
(b) Find the least-squares equation \(\hat{y}=b_{0}+b_{1} x_{1}+b_{2} x_{2}\), where \(x_{1}\) is the number of licensed drivers, \(x_{2}\) is an indicator variable where \(0=\) male, \(1=\) female, and \(y\) is the number of fatal crashes.
(c) Interpret the coefficient of each explanatory variable.
Table 7 Age Number of Male Licensed Drivers (000s) Number of Fatal Crashes Number of Female Licensed Drivers (000s) Number of Fatal Crashes -74 4803 2022 5375 980
Step by Step Solution
3.48 Rating (155 Votes )
There are 3 Steps involved in it
a Figure 25 below shows the scatter diagram of the data drawn in Minitab For males 0 we use the symb... View full answer

Get step-by-step solutions from verified subject matter experts