

Question: The data in Table 8.24 represent the results of a test for the strength of an asphalt concrete mix. The test consisted of applying a
The data in Table 8.24 represent the results of a test for the strength of an asphalt concrete mix. The test consisted of applying a compressive force on the top of different sample specimens. Two responses occurred: the stress and strain at which a sample specimen failed. The factors relate to mixture proportions, rates of speed at which the force was applied, and ambient temperature. Higher values of the response variables indicate stronger materials.
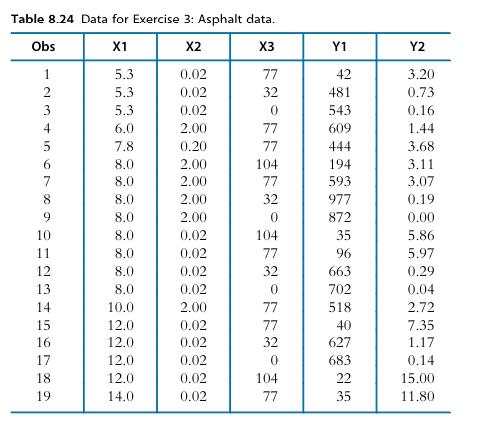
Table 8.24 Data for Exercise 3: Asphalt data. Obs X1 X2 X3 Y1 Y2 1 5.3 0.02 77 42 3.20 2 5.3 0.02 32 481 0.73 3 5.3 0.02 0 543 0.16 4 6.0 2.00 77 609 1.44 5 7.8 0.20 77 444 3.68 6 8.0 2.00 104 194 3.11 7 8.0 2.00 77 593 3.07 8 8.0 2.00 32 977 0.19 9 8.0 2.00 0 872 0.00 10 8.0 0.02 104 35 5.86 11 8.0 0.02 77 96 5.97 12 8.0 0.02 32 663 0.29 13 8.0 0.02 0 702 0.04 14 10.0 2.00 77 518 2.72 15 12.0 0.02 77 40 7.35 16 12.0 0.02 32 627 1.17 17 12.0 0.02 0 683 0.14 18 12.0 0.02 104 22 15.00 19 14.0 0.02 77 35 11.80
Step by Step Solution
3.41 Rating (154 Votes )
There are 3 Steps involved in it

Get step-by-step solutions from verified subject matter experts