

Question: The test scores shown in Table 14.11 were recorded by two different professors for two sections of the same course. Using the Mann Whitney test
The test scores shown in Table 14.11 were recorded by two different professors for two sections of the same course. Using the Mann Whitney test and α = 0:05, determine whether the locations of the two distributions are equal.
Why might the median be a better measure of location than the mean for these data?
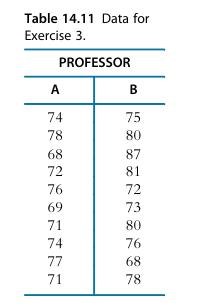
Table 14.11 Data for Exercise 3. PROFESSOR A B 74 75 78 80 68 87 NK F F F F 72 81 76 72 69 73 71 80 74 76 68 78
Step by Step Solution
★★★★★
3.40 Rating (150 Votes )
There are 3 Steps involved in it
1 Expert Approved Answer
Step: 1 Unlock

Question Has Been Solved by an Expert!
Get step-by-step solutions from verified subject matter experts
Step: 2 Unlock
Step: 3 Unlock