

Question: Use the data from University A in Table 7. (a) Determine the percentage of students who have IQ scores within 3 standard deviations of the
Use the data from University A in Table 7.
(a) Determine the percentage of students who have IQ scores within 3 standard deviations of the mean according to the Empirical Rule.
(b) Determine the percentage of students who have IQ scores between 67.8 and 132.2 according to the Empirical Rule.
(c) Determine the actual percentage of students who have IQ scores between 67.8 and 132.2.
(d) According to the Empirical Rule, what percentage of students have IQ scores above 132.2?
Approach To use the Empirical Rule, a histogram of the data must be roughly bell shaped. Figure 14 shows the histogram of the data from University A.
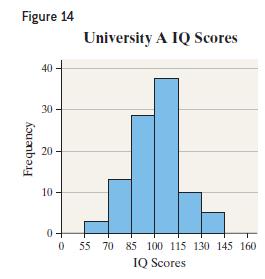
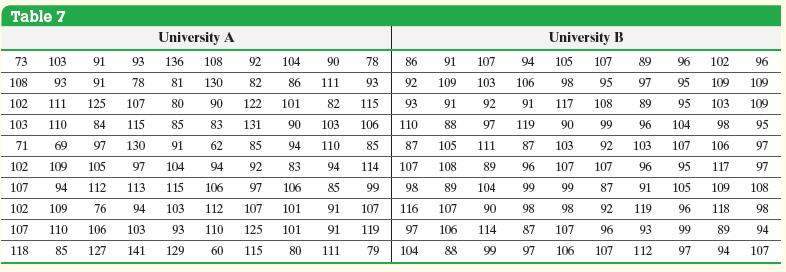
Figure 14 40 University A IQ Scores Frequency 30 20 20 10 0 0 55 70 85 100 115 130 145 160 IQ Scores
Step by Step Solution
3.40 Rating (159 Votes )
There are 3 Steps involved in it
The histogram is roughly bell shaped The mean IQ s... View full answer

Get step-by-step solutions from verified subject matter experts