

Question: Use the data summarized in Table 3 to construct a frequency bar graph and a relative frequency bar graph. Approach Use a horizontal axis to
Use the data summarized in Table 3 to construct a frequency bar graph and a relative frequency bar graph.
Approach Use a horizontal axis to indicate the categories of the data (body parts) and a vertical axis to represent the frequency or relative frequency. Draw rectangles of equal width to the height that is the frequency or relative frequency for each category. The bars do not touch each other.
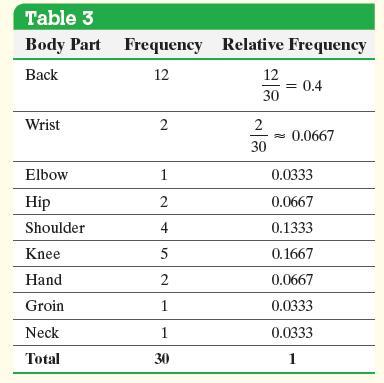
Table 3 Body Part Frequency Relative Frequency Back 12 12 = 0.4 30 Wrist 2 28 = 0.0667 30 Elbow 1 0.0333 Hip 2 0.0667 Shoulder 4 0.1333 Knee 5 0.1667 Hand 2 0.0667 Groin 1 0.0333 Neck 1 0.0333 Total 30 1
Step by Step Solution
3.42 Rating (158 Votes )
There are 3 Steps involved in it
Figure 1 a shows t... View full answer

Get step-by-step solutions from verified subject matter experts