

Question: Use the results from Example 1 to construct a boxplot of the finishing times of the men in the 60- to 64-year-old age group. Data
Use the results from Example 1 to construct a boxplot of the finishing times of the men in the 60- to 64-year-old age group.
Data from Example 1
The data shown in Table 17 show the finishing times (in minutes) of the men in the 60- to 64-year-old age group in a 5- kilometer race. Determine the five-number summary of the data.
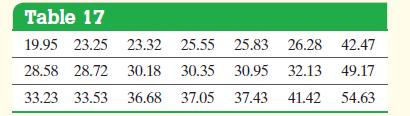
Table 17 19.95 23.25 23.32 25.55 25.83 26.28 42.47 28.58 28.72 30.18 30.35 33.23 33.53 36.68 37.05 30.95 32.13 49.17 37.43 41.42 54.63
Step by Step Solution
★★★★★
3.41 Rating (167 Votes )
There are 3 Steps involved in it
1 Expert Approved Answer
Step: 1 Unlock

Question Has Been Solved by an Expert!
Get step-by-step solutions from verified subject matter experts
Step: 2 Unlock
Step: 3 Unlock