

Question: Verify that the residuals obtained in Table 2 are normally distributed. Approach Construct a normal probability plot to assess normality. If the correlation between the
Verify that the residuals obtained in Table 2 are normally distributed.
Approach Construct a normal probability plot to assess normality. If the correlation between the residuals and expected \(z\)-scores is greater than the critical value in Table VI, the residuals are said to be normal.
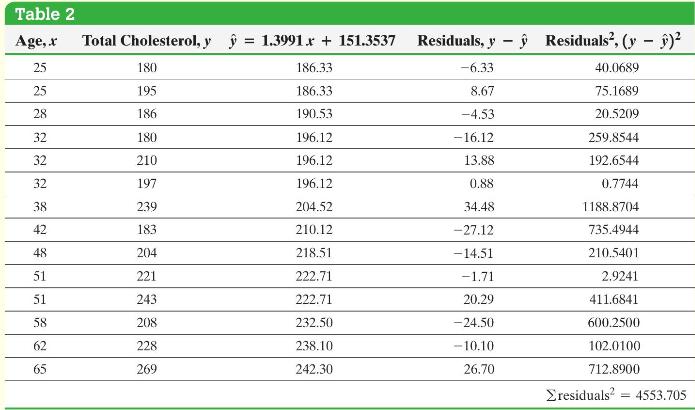
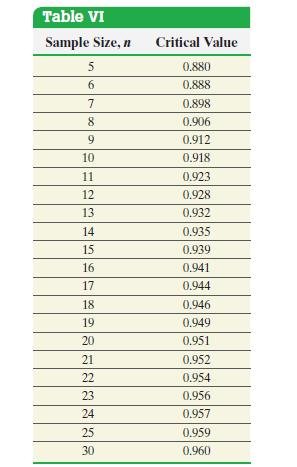
Table 2 Age, x Total Cholesterol, y = 1.3991x+151.3537 - Residuals, y Residuals, (y - ) 25 180 186.33 -6.33 40.0689 25 195 186.33 8.67 75.1689 28 186 190.53 -4.53 20.5209 32 180 196.12 -16.12 259.8544 32 210 196.12 13.88 192.6544 32 197 196.12 0.88 0.7744 38 239 204.52 34.48 1188.8704 42 183 210.12 -27.12 735.4944 48 204 218.51 -14.51 210.5401 51 221 222.71 -1.71 2.9241 51 243 222.71 20.29 411.6841 58 208 232.50 -24.50 600.2500 62 228 238.10 -10.10 102.0100 65 269 242.30 26.70 712.8900 residuals24553.705
Step by Step Solution
3.52 Rating (152 Votes )
There are 3 Steps involved in it
Figure 7 contains the normal probability plot The correl... View full answer

Get step-by-step solutions from verified subject matter experts