

Question: We have data on the distance covered by irrigation water in a furrow of a field. The data are to be used to relate the
We have data on the distance covered by irrigation water in a furrow of a field. The data are to be used to relate the distance covered to the time since watering began. The data are given in Table 8.28.
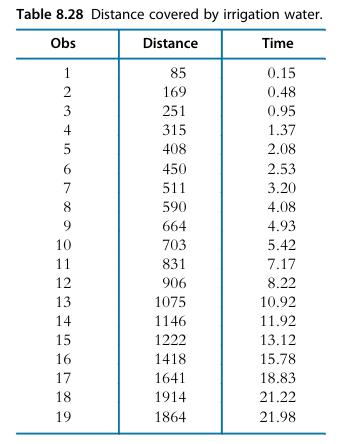
(a) Perform a simple linear regression relating distance to time. Plot the residuals against time. What does the plot suggest?
(b) Perform a regression using time and the square of time. Interpret the results. Are they reasonable?
(c) Plot residuals from the quadratic model. What does this plot suggest?
Table 8.28 Distance covered by irrigation water. Obs Distance Time 10 11 12345678DDNSS 85 0.15 169 0.48 251 0.95 315 1.37 408 2.08 450 2.53 511 3.20 590 4.08 9 664 4.93 703 5.42 831 7.17 906 8.22 13 1075 10.92 14 1146 11.92 15 1222 13.12 16 1418 15.78 17 18 19 782 1641 18.83 1914 21.22 1864 21.98
Step by Step Solution
3.41 Rating (160 Votes )
There are 3 Steps involved in it

Get step-by-step solutions from verified subject matter experts