

Age of Population The following frequency polygon shows the age distribution of U.S. residents below 100 years
Question:
Age of Population The following frequency polygon shows the age distribution of U.S. residents below 100 years of age on July 1, 2009.
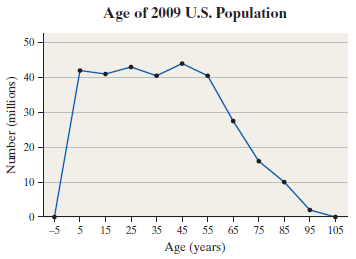
(a) What is the class width? How many classes are represented in the graph?
(b) What is the midpoint of the first class? What are the lower and upper limits of the first class?
(c) What is the midpoint of the last class? What are the lower and upper limits of the last class?
(d) Which age group has the highest population? Estimate the population of this age group.
(e) Which age group has the lowest population? Estimate the population of this age group.
(f) Approximate the total number of U.S. residents below 100 years of age on July 1, 2009.
(g) Between which two classes is the change in population most extreme? Least extreme?
DistributionThe word "distribution" has several meanings in the financial world, most of them pertaining to the payment of assets from a fund, account, or individual security to an investor or beneficiary. Retirement account distributions are among the most...
Step by Step Answer:
a 10 The class width is the difference between successive class midpoints eg 15 5 10 There are 10 cl...View the full answer


Statistics Informed Decisions Using Data
ISBN: 9780321757272
4th Edition
Authors: Michael Sullivan III
