

Question: The following data represent the annual 2011 salary (in thousands of dollars) of a random sample of professional baseball players. (a) Draw a boxplot of
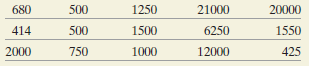
The following data represent the annual 2011 salary (in thousands of dollars) of a random sample of professional baseball players.
(a) Draw a boxplot of the data. Explain why a t-interval cannot be constructed.
(b) Construct a 95% confidence interval for the mean and median salary of a professional baseball player in 2011 using 1000 resamples.
(c) Draw a histogram of the 1000 means. Draw a histogram of the 1000 medians. Comment on the shape of the histograms. What does the shape of the histogram of the sample mean imply about the ability to use t-interval procedures?
(d) Which interval do you believe better explains the average salary? Explain.
680 1250 21000 20000 500 414 1500 6250 1550 500 750 12000 425 2000 1000
Step by Step Solution
3.49 Rating (169 Votes )
There are 3 Steps involved in it
a A tinterval cannot be constructed because there are outliers and the sample size is smal... View full answer

Get step-by-step solutions from verified subject matter experts