

Question: 1. Look at the following scatterplot. What is the most sensible conclusion? The relationship is: a) Positive b) Negative c) Zero d) Non-linear 15.00 10.00-
1. Look at the following scatterplot.
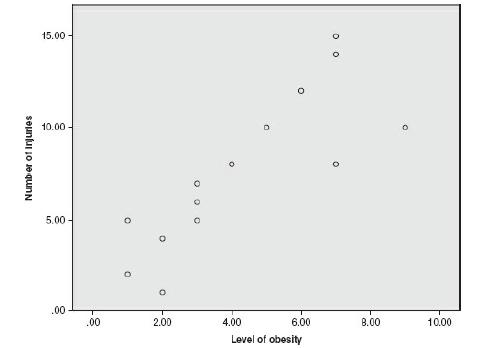
What is the most sensible conclusion? The relationship is:
a) Positive
b) Negative
c) Zero
d) Non-linear
15.00 10.00- Number of Injuries 5.00 o D .00 .00 2.00 4.00 6.00 8.00 10.00 Level of obesity
Step by Step Solution
There are 3 Steps involved in it
1 Expert Approved Answer
Step: 1 Unlock

Question Has Been Solved by an Expert!
Get step-by-step solutions from verified subject matter experts
Step: 2 Unlock
Step: 3 Unlock