

Question: Enter the data in Table 2.5 into SAS and run some summary statistics for both variables and produce a scattergram. Patient satisfaction Time in hospital
Enter the data in Table 2.5 into SAS and run some summary statistics for both variables and produce a scattergram.
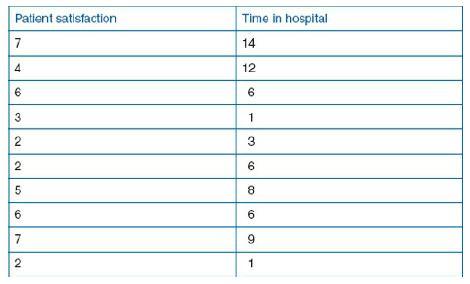
Patient satisfaction Time in hospital 7 14 4 12 6 6 3 1 2 3 2 6 5 8 6 6 7 9 2 1
Step by Step Solution
There are 3 Steps involved in it
1 Expert Approved Answer
Step: 1 Unlock

Question Has Been Solved by an Expert!
Get step-by-step solutions from verified subject matter experts
Step: 2 Unlock
Step: 3 Unlock