

Question: The following data are the solid waste (millions of tons) produced annually in the United States: Construct a pie chart to present the data. Discuss
The following data are the solid waste (millions of tons) produced annually in the United States: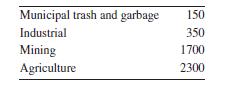
Construct a pie chart to present the data. Discuss the merits of presenting the data in a pie chart versus the tabular summary given.
Municipal trash and garbage 150 Industrial 350 Mining Agriculture 1700 2300
Step by Step Solution
There are 3 Steps involved in it
1 Expert Approved Answer
Step: 1 Unlock

Question Has Been Solved by an Expert!
Get step-by-step solutions from verified subject matter experts
Step: 2 Unlock
Step: 3 Unlock