

Question: The scores on a test were distributed as shown below for a class of 60 students. Convert the frequency histogram to a probability distribution. What
The scores on a test were distributed as shown below for a class of 60 students. Convert the frequency histogram to a probability distribution. What is the probability that a student had a score of at least 90? What is the probability that a student failed the test (F grade), assuming that a score less than 70 was considered an F?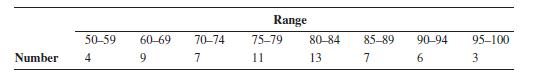
Range 50-59 60-69 Number 4 9 70-74 7 75-79 80-84 85-89 90-94 95-100 11 13 7 6 3
Step by Step Solution
There are 3 Steps involved in it
1 Expert Approved Answer
Step: 1 Unlock

Question Has Been Solved by an Expert!
Get step-by-step solutions from verified subject matter experts
Step: 2 Unlock
Step: 3 Unlock