

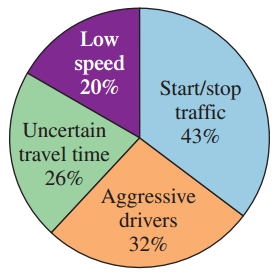
The following circle graph shows the percentage of commuters who are frustrated by particular driving situations. Is
Question:
The following circle graph shows the percentage of commuters who are frustrated by particular driving situations. Is the graph misleading? Explain.
Driving Situations Frustrating to Commuters.
Fantastic news! We've Found the answer you've been seeking!
Step by Step Answer:
Yes the sum of its parts is 121 The sum of the par...View the full answer

Answered By
PALASH JHANWAR
I am a Chartered Accountant with AIR 45 in CA - IPCC. I am a Merit Holder ( B.Com ). The following is my educational details.
PLEASE ACCESS MY RESUME FROM THE FOLLOWING LINK: https://drive.google.com/file/d/1hYR1uch-ff6MRC_cDB07K6VqY9kQ3SFL/view?usp=sharing
3+ Reviews
10+ Question Solved
Related Book For 

A Survey of Mathematics with Applications
ISBN: 978-0134112107
10th edition
Authors: Allen R. Angel, Christine D. Abbott, Dennis Runde
Question Posted:
