

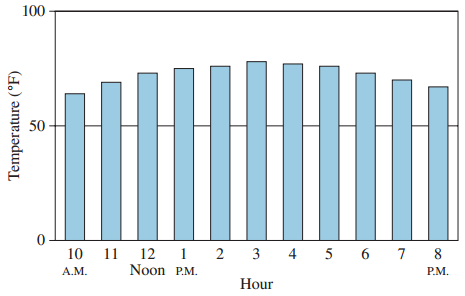
The following graph indicates the hourly temperature, in degrees Fahrenheit, in Rochester, New York, from 10 A.M.
Question:
(a) Use the function t(x) to estimate the temperature in Rochester at 2 P.M. on September 8, 2014. Round your answer to the nearest degree.
(b) Use the graph to determine the hour that the temperature was a maximum.3 p.m.
(c) Determine the x-coordinate of the vertex of the graph of the function t(x).Then use this value in the function t(x) to estimate the maximum temperature. Round your answer for the vertex to the nearest hour. Round your answer for the temperature to the nearest degree.
Hourly Temprature in Rochester, NY, September 8, 2014
Fantastic news! We've Found the answer you've been seeking!
Step by Step Answer:
a 2 AM x 4 t4 0484 2 504 ...View the full answer

Answered By
LAJU THOMAS
Iam a qualified Accountant
Tutoring at Various online Platforms from June 2008 to as on date.
Helped students refine study skills and become independent learners.
0 Reviews
10+ Question Solved
Related Book For 

A Survey of Mathematics with Applications
ISBN: 978-0134112107
10th edition
Authors: Allen R. Angel, Christine D. Abbott, Dennis Runde
Question Posted:
