

The following table shows the number of hiking permits issued for a specific trail at Yellowstone National
Question:
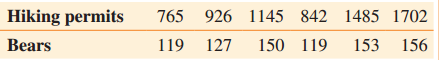
The following table shows the number of hiking permits issued for a specific trail at Yellowstone National Park for selected years and the corresponding number of bears sighted by the hikers on that trail.
(a) Construct a scatter diagram with hiking permits on the horizontal axis.
(b) Use the scatter diagram in part (a) to determine whether you believe that a correlation exists between the number of hiking permits issued and the number of bears sighted by hikers. If so, is it a positive or negative correlation?
(c) Calculate the correlation coefficient between the number of hiking permits issued and the number of bears sighted by hikers.
(d) Determine whether a correlation exists at α = 0.05.
(e) Determine the equation of the line of best fit between the number of hiking permits issued and the number of bears sighted by hikers. Round both m and b to the nearest hundredth. y
(f) Assuming that this trend continues, use the equation of the line of best fit to estimate the number of bears sighted if 1500 hiking permits were issued.
Step by Step Answer:
a b Yes positive c d Yes 0925 0811 e f ...View the full answer


A Survey of Mathematics with Applications
ISBN: 978-0134112107
10th edition
Authors: Allen R. Angel, Christine D. Abbott, Dennis Runde
