

Use the circle graph to answer the questions. Students at Bayshore High School were polled to determine
Question:
Use the circle graph to answer the questions. Students at Bayshore High School were polled to determine the type of music they preferred. There were 1960 students who completed the poll. Their responses are represented in the circle graph below. Round your answers to the nearest tenth of a percent.
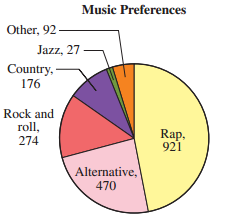
What percent of students preferred country music?
Fantastic news! We've Found the answer you've been seeking!
Step by Step Answer:
1761960 ...View the full answer

Answered By
PALASH JHANWAR
I am a Chartered Accountant with AIR 45 in CA - IPCC. I am a Merit Holder ( B.Com ). The following is my educational details.
PLEASE ACCESS MY RESUME FROM THE FOLLOWING LINK: https://drive.google.com/file/d/1hYR1uch-ff6MRC_cDB07K6VqY9kQ3SFL/view?usp=sharing
3+ Reviews
10+ Question Solved
Related Book For 

A Survey of Mathematics with Applications
ISBN: 978-0134112107
10th edition
Authors: Allen R. Angel, Christine D. Abbott, Dennis Runde
Question Posted:
