

Table 17.8 shows the carbon and nitrogen footprints for transportation fuels. Answer the following questions based on
Question:
Table 17.8 shows the carbon and nitrogen footprints for transportation fuels. Answer the following questions based on these data.
Table 17.8:
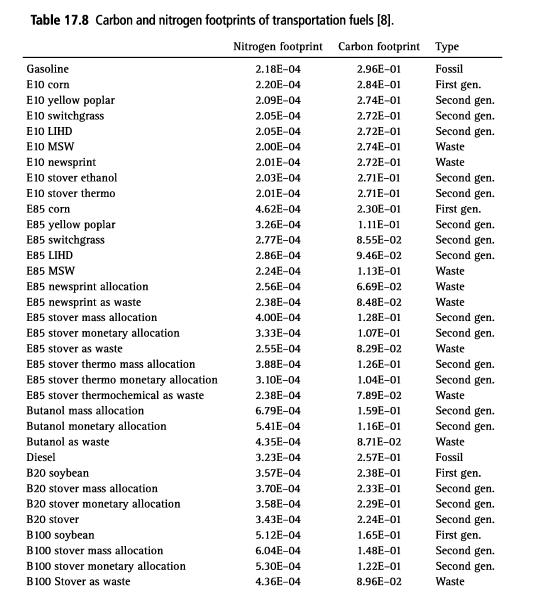
1. Plot the footprints for fossil and first-generation biofuels and determine the Pareto curve. Identify the feasible and infeasible regions for this curve.
2. Now include the points for second-generation biofuels. Do they expand this design space? Justify your finding.
3. Discuss how you would use these results to choose the "best" transportation fuel(s).
Fantastic news! We've Found the answer you've been seeking!
Step by Step Answer:
To answer these questions we first need to understand what a Pareto curve represents In this context it will show the tradeoff between the carbon and ...View the full answer

Answered By
Utsab mitra
I have the expertise to deliver these subjects to college and higher-level students. The services would involve only solving assignments, homework help, and others.
I have experience in delivering these subjects for the last 6 years on a freelancing basis in different companies around the globe. I am CMA certified and CGMA UK. I have professional experience of 18 years in the industry involved in the manufacturing company and IT implementation experience of over 12 years.
I have delivered this help to students effortlessly, which is essential to give the students a good grade in their studies.
2+ Reviews
10+ Question Solved
Related Book For 
Sustainable Engineering Principles And Practice
ISBN: 9781108420457
1st Edition
Authors: Bhavik R. Bakshi
Question Posted:
