

Use the (f)-chart to determine the amount of solar energy that can be delivered in Little Rock,
Question:
Use the \(f\)-chart to determine the amount of solar energy that can be delivered in Little Rock, AR, in January for the following solar and building conditions:
Building
Load: 40 million Btu/month
Latitude: \(35^{\circ} \mathrm{N}\)
Solar system
Collector tilt: \(55^{\circ}\), facing south
Area: \(1000 \mathrm{ft}^{2}\)
Ambient temperature: \(40.6^{\circ} \mathrm{F}\)
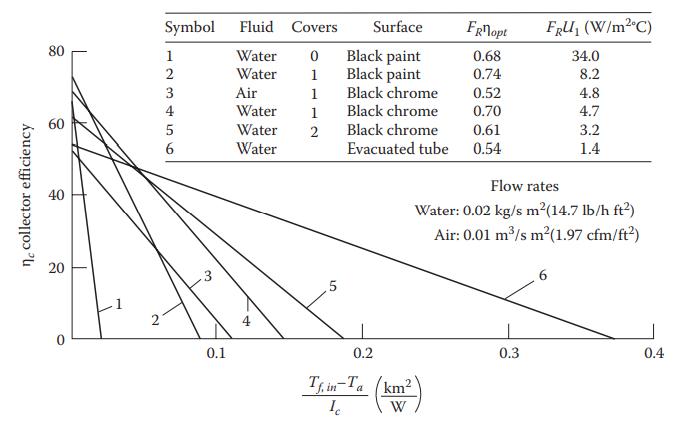
Collector efficiency curve: see Figure 7.19
No heat exchanger used
Nominal storage, flow rate, and load heat-exchanger values used
Figure 7.19
Fantastic news! We've Found the answer you've been seeking!
Step by Step Answer:

Answered By
Isaiah Mutinda
As a graduate with Bs in Maths and Computer Science and having worked as a freelance full stack software developer for 3 years running I believe I have what it takes to conformable tutor and mentor a student to a professional developer also.
2+ Reviews
10+ Question Solved
Related Book For 
Question Posted:
