

Question: Analyze the data of Problem 5 to evaluate whether or not the increase in urbanization has been accompanied by an increase in the annual maximum
Analyze the data of Problem 5 to evaluate whether or not the increase in urbanization has been accompanied by an increase in the annual maximum discharge. Apply the Spearman test with both a 1% and a 5% level of significance. Discuss the results.
Data from problem 5 Develop an MLP model with two hidden layers and three perceptrons with logsig and linear function in each layer, respectively. The input of the MLP model is rainfall, evaporation, and temperature, and the inflow must be simulated. Use the given data in Table 12. 9 for model development.
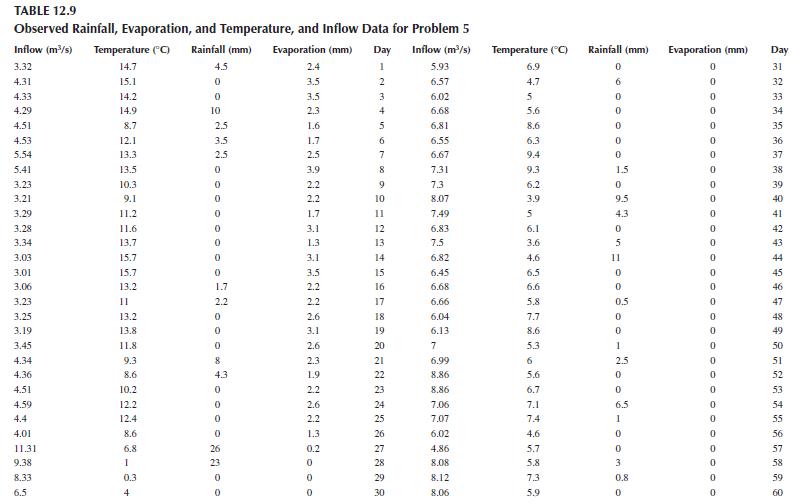
TABLE 12.9 Observed Rainfall, Evaporation, and Temperature, and Inflow Data for Problem 5 Inflow (m/s) Temperature (C) Rainfall (mm) Evaporation (mm) Day Inflow (m/s) Temperature (C) Rainfall (mm) Evaporation (mm) Day 3.32 14.7 4.5 2.4 1 5.93 6.9 0 0 31 4.31 15.1 0 3.5 2 6.57 4.7 6 0 32 4.33 14.2 0 3.5 3 6.02 5 0 0 33 4.29 14.9 10 2.3 4 6.68 5.6 0 0 4.51 8.7 2.5 1.6 5 6.81 8.6 0 0 35 4.53 12.1 3.5 1.7 6 6.55 6.3 0 0 36 5.54 13.3 2.5 2.5 7 6.67 9.4 0 0 5.41 13.5 3.23 10.3 3.21 9.1 3.29 11.2 3.28 11.6 3.34 13.7 3.03 15.7 3.01 15.7 oooooooo 0 3.9 8 7.31 9.3 1.5 0 0 2.2 9 7.3 6.2 0 0 0 2.2 10 8.07 3.9 9.5 0 0 1.7 11 7.49 5 4.3 0 41 0 3.1 12 6.83 6.1 0 0 0 1.3 13 7.5 3.6 5 0 0 3.1. 14 6.82 4.6 11 0 0 3.5 15 6.45 6.5 0 0 3.06 13.2 1.7 2.2 16 6.68 6.6 0 0 3.23 11 2.2 2.2 17 6.66 5.8 0.5 0 3.25 13.2 0 2.6 18 6.04 7.7 0 0 3.19 13.8 0 3.1 19 3.45 11.8 0 2.6 20 7 69 6.13 8.6 0 0 5.3 1 0 4.34 9.3 8 2.3 21 6.99 6 2.5 0 * * * * * 9 * * * * * * * * * 34 37 38 39 40 42 43 44 45 46 47 48 49 50 51 4.36 8.6 4.51 10.2 4.59 12.2 4.4 12.4 7. 4.3 1.9 22 8.86 5.6 0 0 52 0 2.2 23 8.86 6.7 0 0 53 0 2.6 24 7.06 7.1 6.5 0 54 0 2.2 25 7.07 7.4 1 0 55 4.01 8.6 0 1.3 26 6.02 4.6 0 0 56 11.31 6.8 26 0.2 27 4.86 5.7 0 0 57 9.38 1 23 0 28 8.08 5.8 3 0 58 8.33 0.3 0 0 29 8.12 7.3 0.8 0 59. 6.5 4 0 0 30 8.06 5.9 0 0 60
Step by Step Solution
3.44 Rating (154 Votes )
There are 3 Steps involved in it

Get step-by-step solutions from verified subject matter experts