

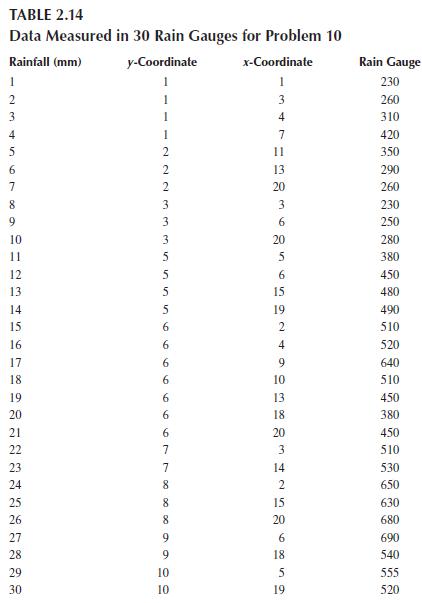
The data measured in 30 rain gauges and the corresponding coordinates are shown in Table 2 .14.
Question:
The data measured in 30 rain gauges and the corresponding coordinates are shown in Table 2 .14.
a. Draw the scattering of gauges.
b. Estimate and draw the empirical variogram.
c. Fit a theoretical variogram to an empirical variogram.
d. Specify and draw the spatial distribution of data at the network with one dimension.
e. Estimate rainfall at points with (3, 19 ), (5, 8 ), and (9, 9 ) coordinates using the developed Kriging model.
Table 2 .14
Step by Step Answer:

This question has not been answered yet.
You can Ask your question!
Related Book For 

Water Systems Analysis Design, And Planning Urban Infrastructure
ISBN: 9780367528454
1st Edition
Authors: Mohammad Karamouz
Question Posted:
