

Question: Using the data in Table 13. 13, compute the 25-year and the 100-year peak discharges. The map skew for this location is 4. 4. TABLE
Using the data in Table 13. 13, compute the 25-year and the 100-year peak discharges. The map skew for this location is 4. 4.
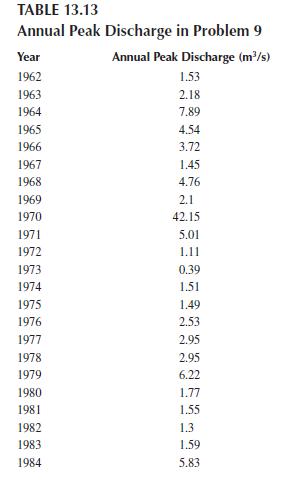
TABLE 13.13 Annual Peak Discharge in Problem 9 Year Annual Peak Discharge (m/s) 1962 1.53 1963 2.18 1964 7.89 1965 4.54 1966 3.72 1967 1.45 1968 4.76 1969 2.1 1970 42.15 1971 5.01 1972 1.11 1973 0.39 1974 1.51 1975 1.49 1976 2.53 1977 2.95 1978 2.95 1979 6.22 1980 1981 1.77 1.55 1982 1.3 1983 1.59 1984 5.83
Step by Step Solution
★★★★★
3.53 Rating (153 Votes )
There are 3 Steps involved in it
1 Expert Approved Answer
Step: 1 Unlock

Question Has Been Solved by an Expert!
Get step-by-step solutions from verified subject matter experts
Step: 2 Unlock
Step: 3 Unlock