

Question: 5. Describe the differences in the meanings between the two structure charts shown. How have the sym- bols changed the meanings? 6. Create a structure
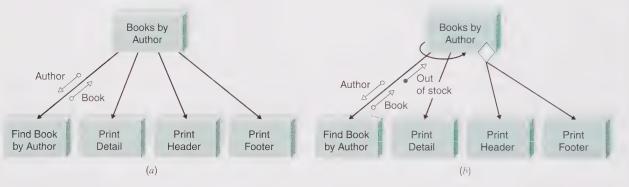
5. Describe the differences in the meanings between the two structure charts shown. How have the sym- bols changed the meanings?
6. Create a structure chart based on the data flow dia- grams (DFDs) that you created for the following exercises in Chapter 5: . Question D Question E Question F Question G Question H
Books by Author Books by Author Author Book Out Author of stock Book Find Book by Author Print Detail Print Header Print Footer Find Book Print Print Print by Author Detail Header Footer (a) (6)
Step by Step Solution
There are 3 Steps involved in it
1 Expert Approved Answer
Step: 1 Unlock

Question Has Been Solved by an Expert!
Get step-by-step solutions from verified subject matter experts
Step: 2 Unlock
Step: 3 Unlock