

Question: For the control system shown in Fig. 3. 16: (a) plot the root loci of the system (b) find the value of gain $K$ such
For the control system shown in Fig. 3. 16:
(a) plot the root loci of the system
(b) find the value of gain $K$ such that the damping ratio $\xi$ of the dominant closed-loop poles is 0. 5
(c) obtain all the closed-loop poles using MATLAB
(d) plot the unit-step response curve using MATLAB.
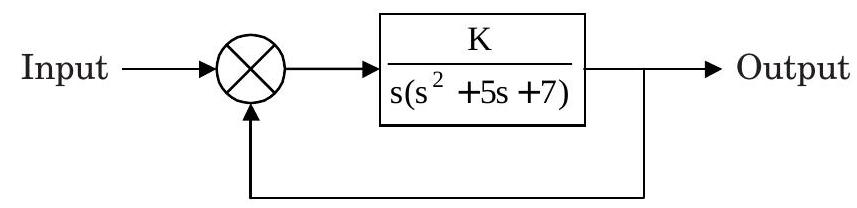
Fig. P 3. 16
Input 2 K s(s +5s +7) Output
Step by Step Solution
★★★★★
3.48 Rating (148 Votes )
There are 3 Steps involved in it
1 Expert Approved Answer
Step: 1 Unlock

Question Has Been Solved by an Expert!
Get step-by-step solutions from verified subject matter experts
Step: 2 Unlock
Step: 3 Unlock