

Question: Plot the frequency response for the filter described in the previous problem for (K=-0.5,0), and 0.5. Data From Problem 2 One implementation of a single
Plot the frequency response for the filter described in the previous problem for \(K=-0.5,0\), and 0.5.
Data From Problem 2
One implementation of a single delay line canceler with feedback is shown below.
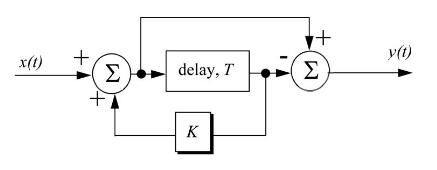
x(t) + delay, T K y(t)
Step by Step Solution
★★★★★
3.45 Rating (164 Votes )
There are 3 Steps involved in it
1 Expert Approved Answer
Step: 1 Unlock

Question Has Been Solved by an Expert!
Get step-by-step solutions from verified subject matter experts
Step: 2 Unlock
Step: 3 Unlock