

Question: Based on the system illustrated in the figure below, draw a fault tree to represent a safe failure (spurious trip) due to the failure of
Based on the system illustrated in the figure below, draw a fault tree to represent a safe failure (spurious trip) due to the failure of the TX1/2 subsystem; that is, the top event is “Nuisance trip due to failure of transmitter subsystem.” Transmitter voting is 1oo2. The following basic events are to be used:
• Safe failure of TX1
• Safe failure of TX2
• Loss of power to transmitter Using the following data, calculate the probability of a nuisance trip.
• Probability of safe failure for a 1-year interval of TX1 = 0.02
• Probability of safe failure for a 1-year interval of TX2 = 0.02
• Probability of loss of power for a 1-year interval to transmitters
= 0.01
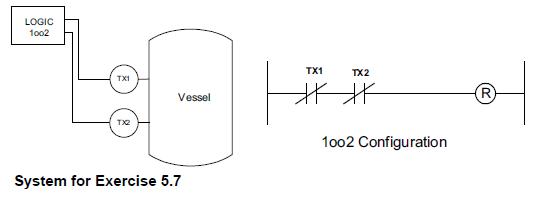
LOGIC 1002 TX1 TX2 System for Exercise 5.7 Vessel TX1 TX2 1002 Configuration R
Step by Step Solution
3.37 Rating (147 Votes )
There are 3 Steps involved in it

Get step-by-step solutions from verified subject matter experts