

Question: For the system from Problem 2.32, plot the real and reactive line losses as cap cap is varied between 0 and 10.0 Mvars.
For the system from Problem 2.32, plot the real and reactive line losses as is varied between 0 and 10.0 Mvars.
Problem 2.32
In PowerWorld Simulator case Problem 2_32 (see Figure 2.28) a 8 MW and 4 Mvar load is supplied at \(13.8 \mathrm{kV}\) through a feeder with an impedance of \(1+j 2 \Omega\). The load is compensated with a capacitor whose output, \(\Omega_{\text {cap }}\), can be varied is 0.5 Mvar steps between 0 and 10.0 Mvars. What value of \(\Omega_{\text {cap }}\) minimizes the real power line losses? What value of \(\Omega_{\text {cap }}\) minimizes the MVA power flow into the feeder?
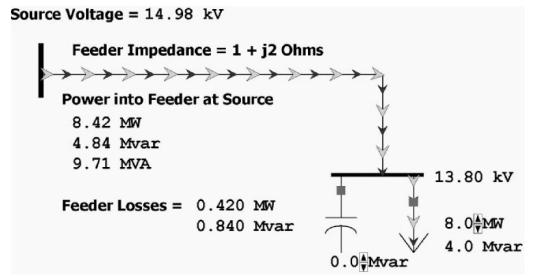
Source Voltage = 14.98 kv Feeder Impedance = 1 + j2 Ohms Power into Feeder at Source 8.42 MW 4.84 Mvar 9.71 MVA Feeder Losses = 0.420 MW 0.840 Mvar 0.0 Mvar 13.80 kV 8.0 MW 4.0 Mvar
Step by Step Solution
3.42 Rating (158 Votes )
There are 3 Steps involved in it

Get step-by-step solutions from verified subject matter experts