

Question: Table P4.61 shows performance data read from one of the Bell & Gossett pump curves in Appendix E. a. For each data point in Table
Table P4.61 shows performance data read from one of the Bell & Gossett pump curves in Appendix E.
a. For each data point in Table P4.61, use the affinity laws to determine the new capacity and head of this pump if the operational speed is reduced to 1750 rpm using a variable speed motor.
b. In the Bell & Gossett Series e-1531 booklet, there is a set of performance curves for a Model 1.5BC pump operating at 1750 rpm. At each of the capacity values calculated from the affinity laws, determine the corresponding head from the 1.5BC 1750 rpm performance curve.
c. For each capacity value at 1750 rpm, you now have two head values; one calculated with the affinity laws and one read directly from the 1.5BC 1750 rpm pump performance curve. Compare these two head values by calculating the percent difference between the calculated value and the actual value using the following equation,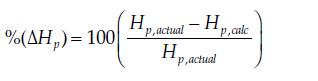
d. Based on the results, comment on the validity of the affinity laws for this application.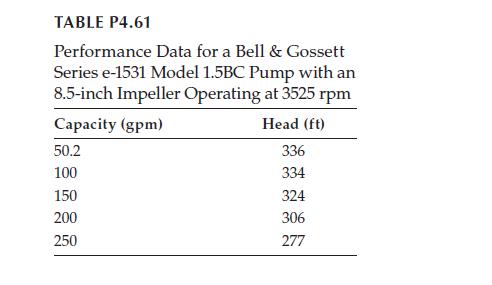
%(AH)= 100 H p.actual - H H p, actual P.calc
Step by Step Solution
3.46 Rating (159 Votes )
There are 3 Steps involved in it

Get step-by-step solutions from verified subject matter experts