

A study of the endangered saiga antelope (pictured at the beginning of the chapter) recorded the fraction
Question:
A study of the endangered saiga antelope (pictured at the beginning of the chapter) recorded the fraction of females in the population that were fecund in each year between 1993 and 2001 (Milner-
Gulland et al. 2003). A graph of the data is as follows:
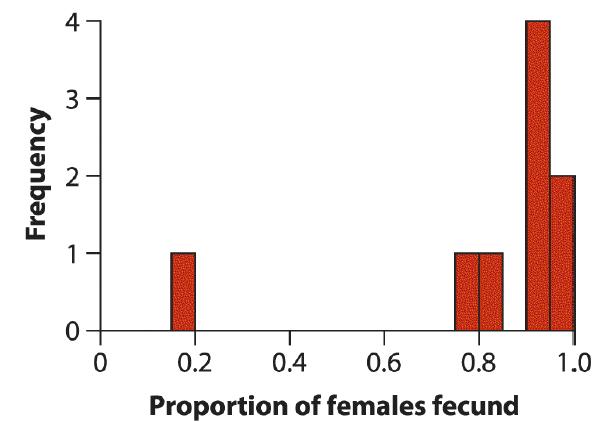
a. Assume that you want to describe the “typical” fraction of females that are fecund in a typical year, based on these data. What would be the better choice to describe this typical fraction, the mean or the median of the measurements? Why?
b. With the same goal in mind, what would be the better choice to describe the spread of measurements around their center, the standard deviation or the interquartile range? Why?
Step by Step Answer:
a The better choice to describe the typical fraction of females that are fecund in a typical year ba...View the full answer


The Analysis Of Biological Data
ISBN: 9781319226237
3rd Edition
Authors: Michael C. Whitlock, Dolph Schluter
