

Below are frequency distributions of a variable in four hypothetical populations. a. For each graph (i through
Question:
Below are frequency distributions of a variable in four hypothetical populations.
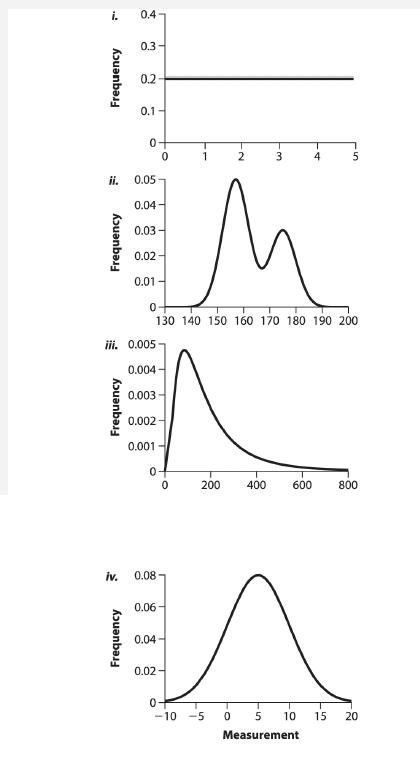
a. For each graph (i through iv), say whether the distribution appears to be a normal distribution.
b. For each graph, imagine that you want to test the null hypothesis that the mean or median is zero based on a random sample. What statistical method would you use? If you suggest a transformation of the data, say why you chose that transformation.
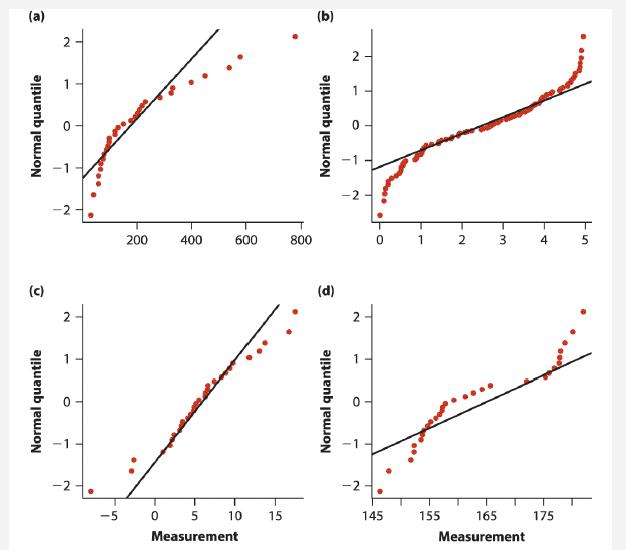
c. Match the distributions given in this problem to the quantile plots of samples in Practice Problem 4.
Data from problem
The four graphs shown below are normal quantile plots for four different data sets, each sampled randomly from a different population. For each graph, say whether the distribution is close to a normal distribution.
Step by Step Answer:
a i No this is a uniform distribution not a normal distribution ii No ...View the full answer


The Analysis Of Biological Data
ISBN: 9781319226237
3rd Edition
Authors: Michael C. Whitlock, Dolph Schluter
