

Calculation practice: Box plots. Here is another sample of systolic blood pressure (in units of mm Hg),
Question:
Calculation practice: Box plots. Here is another sample of systolic blood pressure (in units of mm Hg), this time with 101 data points. The mean is 122.73 and the standard deviation is 13.83.
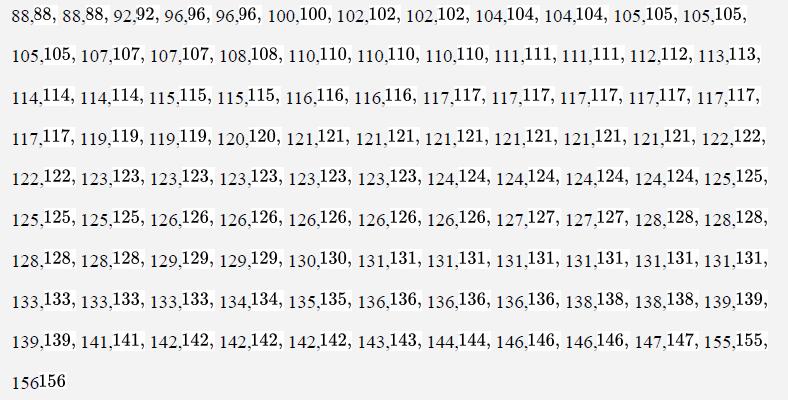
a. What is the median of this sample?
b. What is the upper (third) quartile (or 75th percentile)?
c. What is the lower (first) quartile (or 25th percentile)?
d. What is the interquartile range (IQR)?
e. Calculate the upper quartile plus 1.5 times the IQR. Is this greater than the largest value in the data set?
f. Calculate the lower quartile minus 1.5 times the IQR. Is this less than the smallest value in the data set?
g. Plot the data in a box plot. (A rough sketch by hand is appropriate, as long as the correct values are shown for each critical point.)
Step by Step Answer:
a There are 101 data points an odd number and so the ...View the full answer


The Analysis Of Biological Data
ISBN: 9781319226237
3rd Edition
Authors: Michael C. Whitlock, Dolph Schluter
