

Question: Calculation practice: Confidence interval for the mean using log transformation. Refer to Practice Problem 19 in Chapter 10. Health spending per person from a random
Calculation practice: Confidence interval for the mean using log transformation. Refer to Practice Problem 19 in Chapter 10. Health spending per person from a random sample of 20 countries is given below.
We will use this sample to estimate the mean of log health expenditure, including a confidence interval.
a. Visualize the frequency distribution of the data using a histogram. What feature or features of this distribution indicate that the data are likely not from a population having normal distribution?
b. What features of this distribution make it a good candidate to try a log transformation?
c. Calculate the natural log transformation for each data point in the sample.
d. What is the sample size?
e. What is the mean of the log health expenditure?
f. What is the standard deviation of the mean log health expenditure?
g. Calculate the standard error of the mean log health expenditure.
h. Calculate the 95% confidence interval for mean log health expenditure.
i. What are the limits of this confidence interval expressed on the original (i.e., non-log) scale?
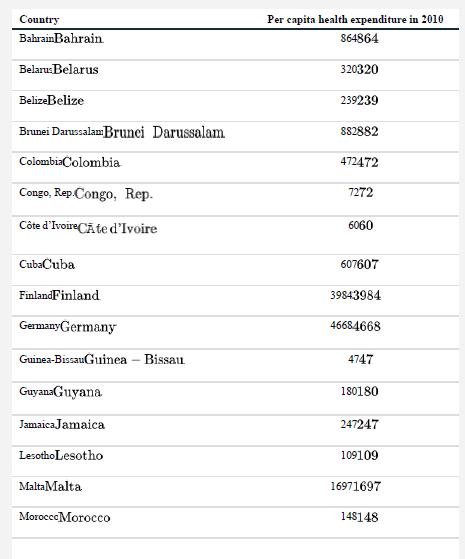
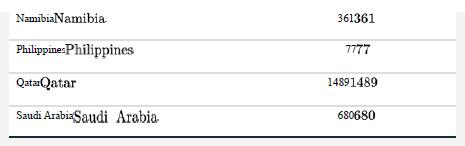
Data from practice problem
Recall from Example 10.4 that more women (29.1%) than men (11.1%) are excluded from the astronaut pilot program by the minimum and maximum height restrictions. What value of minimum height for women would exclude the same total proportion of women as men, given that 0.3% of women are too tall?
Country Bahrain Bahrain. Belarus Belarus Belize Belize Brunei Darussalam Brunei Darussalam Colombia Colombia Congo, Rep Congo, Rep. Cte d'IvoireCte d'Ivoire CubaCuba Finland Finland Germany Germany Guinea-BissauGuinea - Bissau Guyana Guyana Jamaica Jamaica Lesotho Lesotho Malta Malta Morocco Morocco Per capita health expenditure in 2010 864864 320320 239239 882882 472472 7272 6060 607607 39843984 46684668 4747 180180 247247 109109 16971697 148148
Step by Step Solution
3.58 Rating (158 Votes )
There are 3 Steps involved in it
a Distribution is heavily skewed to the right rather ... View full answer

Get step-by-step solutions from verified subject matter experts