

Calculation practice. Estimate a correlation coefficient. In their study of hyena laughter, or giggling (see Chapter 12,
Question:
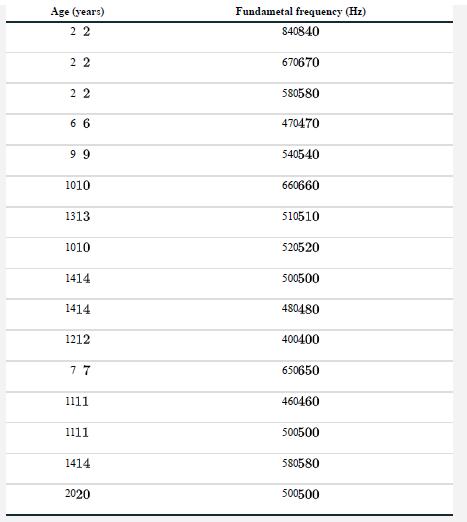
Calculation practice. Estimate a correlation coefficient. In their study of hyena laughter, or “giggling” (see Chapter 12, Assignment Problem 24), Mathevon et al. (2010) asked whether sound spectral properties of hyenas’ giggles are associated with age. The accompanying figure and data show the giggle fundamental frequency (in hertz) and the age (in years) of 16 hyenas. What is the correlation coefficient in the data, and what is the most-plausible range of values for the population correlation?
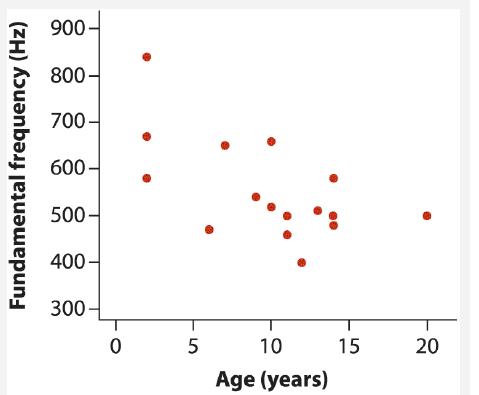
a. What type of graph is this? Does it suggest a positive or negative association?
b. Calculate the sum of squares for age.
c. Calculate the sum of squares for fundamental frequency.
d. Calculate the sum of products between age and frequency.
e. Compute the correlation coefficient, rr .
f. Compute the Fisher’s z-transformation of the correlation coefficient.
g. Calculate the approximate standard error of the z-transformed correlation.
h. What is Zcrit , the two-tailed critical value of the standard normal distribution corresponding to α=0.05?
i. Calculate the lower and upper bounds of the 95% confidence interval for ζ , the z-transformed population correlation.
j. Transform the lower and upper bounds of the confidence interval for ζ , yielding the 95% confidence interval for pp.
Data from practice problem 24
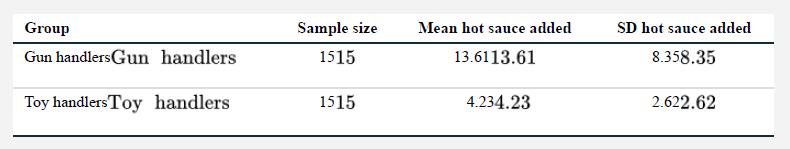
Does holding a weapon increase your aggressiveness afterward in other situations Klinesmith et al. (2006) investigated this question by assigning 30 male college students to one of two groups. One group of 15 men were given a facsimile handgun to hold for 15 minutes, whereas the 15 men in the other group were given a toy instead.
All men were then asked to participate in a test of taste sensitivity. Each was given a glass of water with a single drop of hot sauce to taste. Each man was also asked to add as much hot sauce as he wanted to a new glass of water to be given to the next person.
(These were not actually used on the next person.) The researchers measured how much hot sauce each man added, as a stand-in for aggression, because it correlates with the amount of pain inflicted on the next person. Do the two groups differ in the mean amount of hot sauce they add to the water? Here is a summary of the results:
Step by Step Answer:
a Scatter plot Negati...View the full answer


The Analysis Of Biological Data
ISBN: 9781319226237
3rd Edition
Authors: Michael C. Whitlock, Dolph Schluter
