

For each of the sets of samples in the accompanying figures (a)(e), state which approach is best
Question:
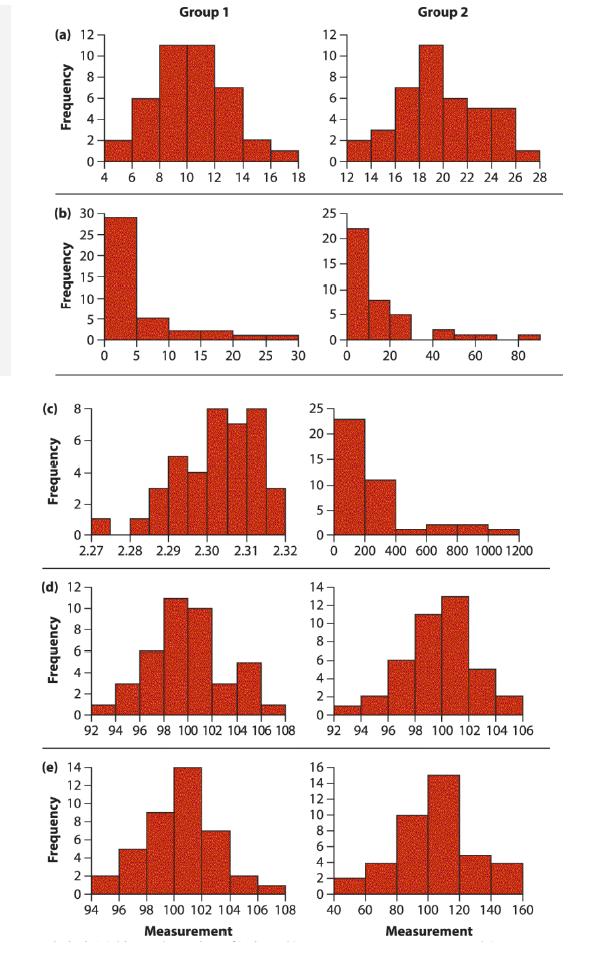
For each of the sets of samples in the accompanying figures (a)–(e), state which approach is best if the goal is to test the difference between the means of group 1 (on the left) and group 2 (on the right). Pay careful These graphs have not been drawn according to the best practices that we outlined in Chapter 2 (histograms of two samples should be displayed one above the other and on the same scale), but they are similar to those you might obtain if you plotted them separately with a computer program. Attention to differences between samples in the scales of the x-axis.
Fantastic news! We've Found the answer you've been seeking!
Step by Step Answer:
a Twosample ttest b These distributions are skewed right so a logtransformation could be ...View the full answer

Answered By
JAPHETH KOGEI
Hi there. I'm here to assist you to score the highest marks on your assignments and homework. My areas of specialisation are:
Auditing, Financial Accounting, Macroeconomics, Monetary-economics, Business-administration, Advanced-accounting, Corporate Finance, Professional-accounting-ethics, Corporate governance, Financial-risk-analysis, Financial-budgeting, Corporate-social-responsibility, Statistics, Business management, logic, Critical thinking,
So, I look forward to helping you solve your academic problem.
I enjoy teaching and tutoring university and high school students. During my free time, I also read books on motivation, leadership, comedy, emotional intelligence, critical thinking, nature, human nature, innovation, persuasion, performance, negotiations, goals, power, time management, wealth, debates, sales, and finance. Additionally, I am a panellist on an FM radio program on Sunday mornings where we discuss current affairs.
I travel three times a year either to the USA, Europe and around Africa.
As a university student in the USA, I enjoyed interacting with people from different cultures and ethnic groups. Together with friends, we travelled widely in the USA and in Europe (UK, France, Denmark, Germany, Turkey, etc).
So, I look forward to tutoring you. I believe that it will be exciting to meet them.
2+ Reviews
10+ Question Solved
Related Book For 

The Analysis Of Biological Data
ISBN: 9781319226237
3rd Edition
Authors: Michael C. Whitlock, Dolph Schluter
Question Posted:
