

In large wolf populations, most inbreeding coefficients of litters are close to zero, and very few are
Question:
In large wolf populations, most inbreeding coefficients of litters are close to zero, and very few are as high or higher than 0.25. What effect is this narrower range of inbreeding coefficients expected to have on the correlation between the number of pups surviving and inbreeding coefficient, compared with that measured in the Scandinavian population of Example 16.2? Explain.
Data from example 16.2
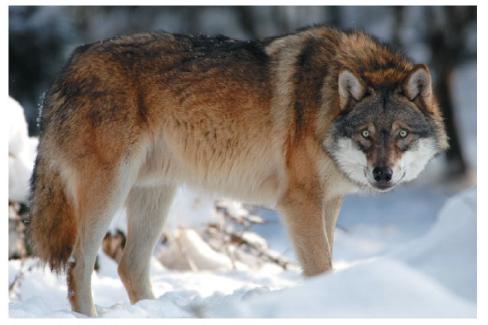
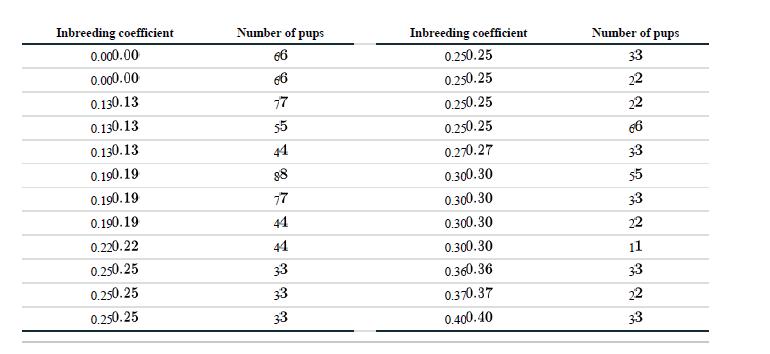
By 1970, the wolf (Canis lupus) had been wiped out in Norway and Sweden. Around 1980, two wolves immigrated from farther east and founded a new population. By 2002, the new population totaled approximately 100 wolves. A new population started by so few individuals, however, might be expected to suffer problems caused by inbreeding. Liberg et al. (2005) compiled observations on reproduction between 1983 and 2002 and constructed the pedigree of the wolves in the small population. The data listed in Table 16.2-1 show the inbreeding coefficients of litters produced by mated pairs and the number of pups of each litter surviving their first winter. An inbreeding coefficient is zero if parents of the litter were unrelated, 0.25 if parents were brother and sister whose own parents were unrelated, and greater than 0.25 if inbreeding had continued for more generations. TABLE 16.2-1 Inbreeding coefficients of litters of mated wolf pairs and the number of pups surviving their first winter. n=24 litters.
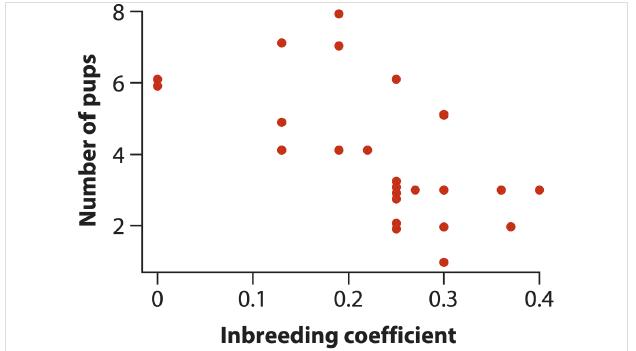
Are inbreeding coefficients of the litters associated with the number of pups surviving their first winter? A scatter plot of the data, shown in Figure 16.2-1, suggests a negative association between inbreeding coefficient and number of surviving pups.
The correlation coefficient between inbreeding coefficient and number of pups can be calculated from the following quantities:
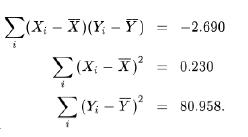
Putting these into the formula for r gives r=−2.690/√0.230√80.958=−0.623. The observed correlation coefficient is less than zero, but we want to test whether this correlation is sufficiently strong to warrant rejection of the null hypothesis that the population correlation ρρ is zero. Our two hypotheses are as follows: H0: There is no relationship between the inbreeding coefficient and the number of pups (ρ=0). HA : Inbreeding depression and the number of pups are correlated (ρ≠0). To test the hypotheses, we calculate the t-statistic t=r/SEr, where the standard error (SEr) is calculated as SEr= √1−r2−2. Under the null hypothesis of zero correlation, the sampling distribution of the tt statistic is a Student’s t-distribution with n−2 degrees of freedom. For the wolf data,
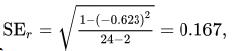
and so, t=−0.623/0.167=−3.74. The P-value for this t-statistic is P=0.001, obtained using a computer. Using Statistical Table C instead, the critical value for the t-distribution having 22 degrees of freedom is t0.05(2),22=2.075 with α=0.05. Since t=−3.74 is less than −2.075 and farther from the value expected by the null hypothesis, P must be less than 0.05. With P=0.001, we can be confident that inbreeding coefficient and number of pups are negatively related, and we reject the null hypothesis of zero correlation.
Step by Step Answer:
A narrower range of values for inb...View the full answer


The Analysis Of Biological Data
ISBN: 9781319226237
3rd Edition
Authors: Michael C. Whitlock, Dolph Schluter
