

Male zebra finches have bright red beaks (see Assignment Problem 18), and experiments have shown that females
Question:
Male zebra finches have bright red beaks (see Assignment Problem 18), and experiments have shown that females prefer males with the reddest beaks. The red coloration in the beak comes from a class of pigments called carotenoids, which must be obtained in the diet of the birds. Pairs of brother finches were randomly assigned to alternative treatments: one was fed extra dietary carotenoids, the other was fed a diet low in carotenoids (Blount et al. 2003). Ten females were given a choice between brothers.
Each female’s preference was measured by the percentage of time she sat next to the carotenoid-supplemented male, standardized so that zero indicates equal time for each brother. Here are the preference data for each of the 10 pairs:
![]()
Choose an appropriate method and test whether females preferred one type of male over the other type.
Data from problem 18
The conventional wisdom is that people who play a lot of sports have more sexual partners than those who do not. To test this, a group of French researchers asked two groups of students how many sex partners they had had in the previous year (Faurie et al. 2004). One group was composed of 250 physical education majors who regularly participated in sports; the other group was composed of 50 biology majors who did not regularly do sports. The distribution of number of sex partners is shown in the graph below. Biology majors claimed an average of 1.24 sex partners in the previous year, while sports majors claimed an average of 2.4 partners in the previous year.
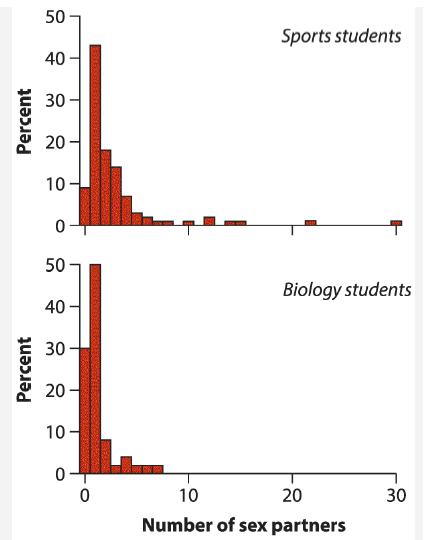
As you can see, the distributions are very different from a normal distribution, and even with a log transformation the distributions are not normal. As a result, the researchers used a Mann–Whitney U-test to compare the median numbers of sex partners for the two groups. They found that the U1 value corresponding to the biology majors was 8500.5, while the U2 value corresponding to the sports group was 3999.5.
Step by Step Answer:
These are interesting problems involving statistical analysis Lets tackle them one by one Zebra Finc...View the full answer


The Analysis Of Biological Data
ISBN: 9781319226237
3rd Edition
Authors: Michael C. Whitlock, Dolph Schluter
