

Refer to Assignment Problem 27 on fiddler crab claws. a. The table at the bottom of the
Question:
Refer to Assignment Problem 27 on fiddler crab claws.
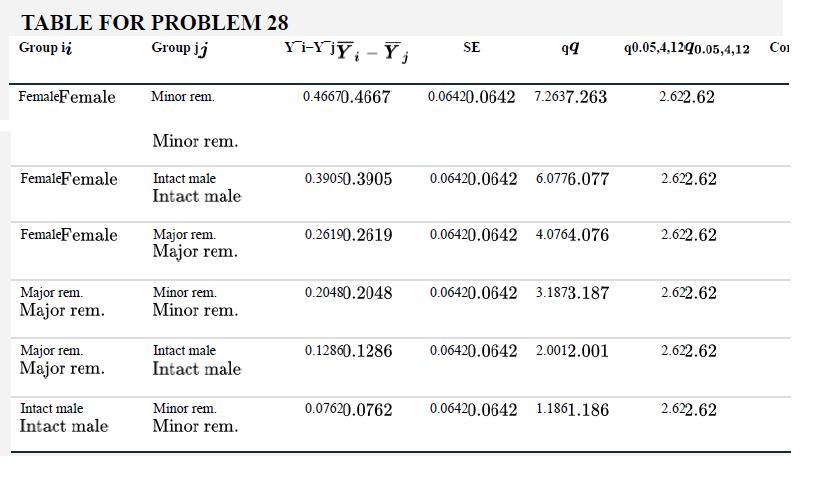
a. The table at the bottom of the page shows partial results of Tukey–Kramer multiple comparisons of means. In what way does this method differ from the method identified in part (a)?
b. Complete the table by adding the test conclusions.
c. Use symbols to illustrate the results of the Tukey–Kramer test. Describe in words which population means are grouped together based on statistical significance.
Data from problem 27
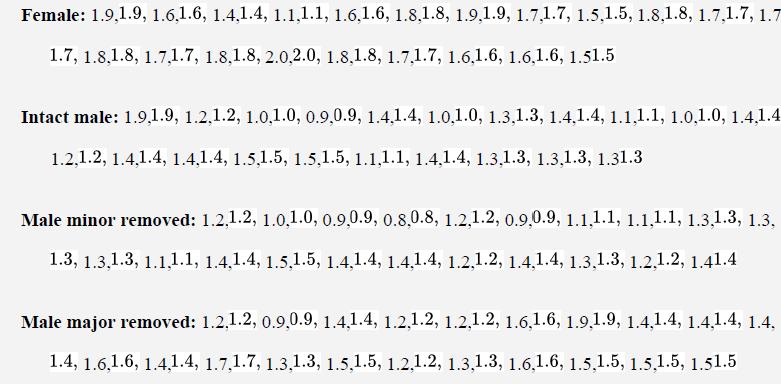
Fiddler crabs are so called because males have a greatly enlarged “major” claw, which is used to attract females and to defend a burrow. Darnell and Munguia (2011) recently suggested that this appendage might also act as a heat sink, keeping males cooler while out of the burrow on hot days. To test this, they placed four groups of crabs into separate plastic cups and supplied a source of radiant heat (60-watt light bulb) from above. The four groups were intact male crabs; male crabs with the major claw removed; male crabs with the other (minor) claw removed (control); and intact female fiddler crabs. They measured body temperature of crabs every 10 minutes for 1.5 hours. These measurements were used to calculate a rate of heat gain for every individual crab in degrees C/log minute. Rates of heat gain for all crabs are provided below.
a. Show these data in a graph. What trends are suggested?
b. Use ANOVA to test whether mean rate of heat gain differs among groups.
Step by Step Answer:
python import matplotlibpyplot as plt Data from the problem statement femaledata 19 19 16 16 14 14 11 11 16 18 18 19 19 17 15 15 17 18 18 17 17 18 20 ...View the full answer


The Analysis Of Biological Data
ISBN: 9781319226237
3rd Edition
Authors: Michael C. Whitlock, Dolph Schluter
