

Spot the flaw. Refer to Problem 14. Grover, a student who skipped reading Chapter 2 of this
Question:
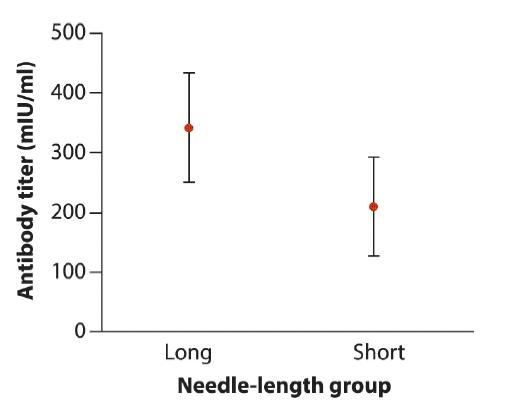
Spot the flaw. Refer to Problem 14. Grover, a student who skipped reading Chapter 2 of this book, made the following graph when presenting the results of the needle-length study to his epidemiology class. The points are means, and the error bars are 95% confidence intervals. What is the biggest weakness of the graph?
Data from Problem 14
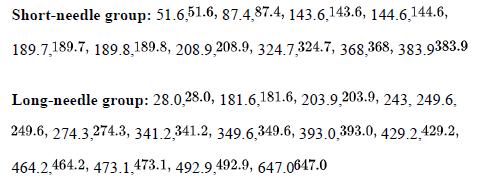
Previous studies have shown that the antibody titers in obese people are lower after vaccination than in people of normal weight. One suggested reason is that the vaccines may not effectively penetrate the layer of subcutaneous fat in obese individuals. To test this, Middleman et al. (2010) compared the response to hepatitis B virus vaccine in obese participants in two different groups. The researchers vaccinated one group of 10 individuals with standard 1-inch (2.5 cm) needles. They used 1.5-inch (3.8 cm) needles instead for a second group of 14 individuals. They later measured the antibody titers (in units of mIU/ml ) of each participant. Greater numbers indicate a more successful response to the vaccine. These results are as follows.
Step by Step Answer:
The graph fails to show the data The data points s...View the full answer


The Analysis Of Biological Data
ISBN: 9781319226237
3rd Edition
Authors: Michael C. Whitlock, Dolph Schluter
