

The experiment described in Example 12.2 compared antibody production in 13 male red-winged blackbirds before and after
Question:
The experiment described in Example 12.2 compared antibody production in 13 male red-winged blackbirds before and after testosterone implants. The units of antibody levels were log 10−3 optical density per minute (ln[mOD/min]). The mean change in antibody production was d¯=0.056, and the standard deviation was sd=0.159.
If you were assigned the task of repeating this experiment to test the hypothesis that testosterone changed antibody levels, what sample size (i.e., number of blackbirds) would you plan to ensure that a mean change of 0.05 units could be detected with probability 0.8? Explain the steps you took to determine this value.
Data from example 12.2
In many species, males are more likely to attract females if the males have high testosterone levels. Are males with high testosterone paying a cost for this extra mating success in other ways? One hypothesis is that males with high testosterone might be less able to fight off disease—that is, their high levels of testosterone might reduce their immunocompetence. To test this idea, Hasselquist et al. (1999) experimentally increased the testosterone levels of 13 male red-winged blackbirds by surgically implanting a small permeable tube filled with testosterone. They measured immunocompetence as the rate of antibody production in response to a nonpathogenic antigen in each bird’s blood serum both before and after the implant. The antibody production rates were measured optically, in units of log 10−3 optical density per minute (ln[mOD/min]). The graph in Figure 12.2-1 shows that there is considerable variation among birds in their natural antibody production rates and that antibody production went up after the implant in some birds but went down in others. What is the mean difference between before and after the implant? We can address this question by constructing a confidence interval for the mean change in antibody production.
![Antibody production rate (In[mOD/min]) 5.0 4.8 4.6 4.4 4.2- 4.0 Before Implant treatment After](https://dsd5zvtm8ll6.cloudfront.net/images/question_images/1702/9/7/3/8546581519e276761702973852402.jpg)
The first step is to calculate the difference in antibody production for each male. The data, listed in Table 12.2-1, consist of a pair of measurements for each male: antibody production before the testosterone implant and antibody production after the implant. We calculated the difference between measurements within each male i as di = (antibody production of male i after)−(antibody production of male i before).
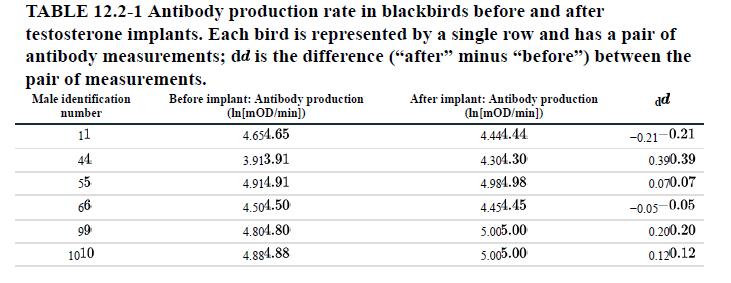
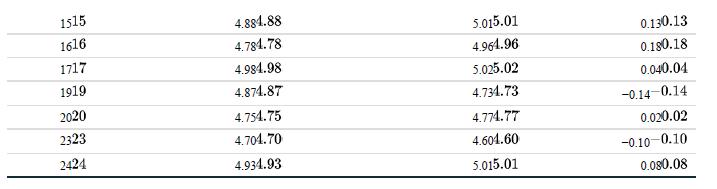
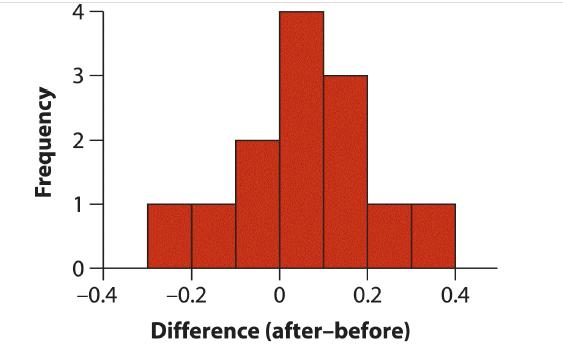
For bird 1, for example, d1=4.44−4.65=− 0.21. It doesn’t much matter whether we subtract the “after” measurement from the “before” measurement (as in Table 12.2-1) or vice versa, but it is critical that we calculate the differences the same way for every individual. A histogram of the resulting differences is shown in Figure 12.2-2.
We then find the sample mean difference (call it d¯), the sample standard deviation of the differences (sd ), and the sample size (n): d¯=0.056, sd=0.159, and n=13.
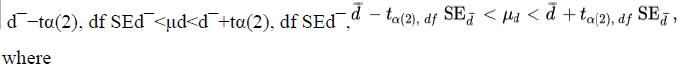
The trend was for immunocompetence (measured by the rate of antibody production) to go up after the testosterone implant, not down as predicted by the hypothesis. The confidence interval for the mean of a paired difference is generated in the same way as the confidence interval for any other mean (see Section 11.2). The confidence interval for the mean difference (μd ) is:
![]()
is the standard error of the mean difference. Note that n is the number of pairs, not the total number of measurements, because pairs are the independent sampling unit. For this reason, we are carrying out the analysis on the differences. For the blackbird data, we calculate SEd¯=0.159/√13 = 0.044. With n=13, we have df=12, so we look in Statistical Table C to find t0.05(2), 12=2.18. Thus, the 95% confidence interval for the mean difference between antibody production before and after testosterone implants is d¯−tα(2), df SEd¯
In other words, the most-plausible range for the true mean difference is between −0.040 and 0.152 ln[mOD/min]. While this span includes zero, it is also consistent with the possibility of a modest drop in immunocompetence following testosterone implant. A larger sample of individuals would be needed to narrow the interval further.
Step by Step Answer:

This question has not been answered yet.
You can Ask your question!


The Analysis Of Biological Data
ISBN: 9781319226237
3rd Edition
Authors: Michael C. Whitlock, Dolph Schluter
