

The following data are scores reflecting the number of young cod that recruited (grew to the catchable
Question:
The following data are scores reflecting the number of young cod that recruited (grew to the catchable size) to the North Sea population in different years (Beaugrand et al. 2003). Scores are adjusted magnitudes (without units) rather than actual fish numbers. The measurements are listed below and arranged from low to high rather than by year.
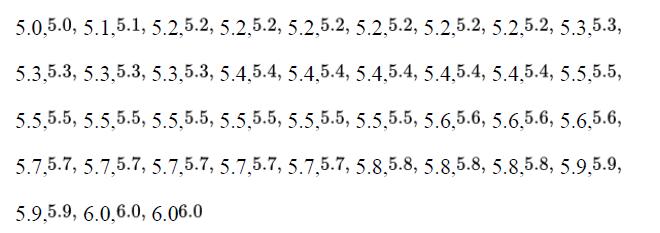
a. What was the mean score for number of recruits over this period?
b. What was the standard deviation in the score of number of recruits?
c. In what fraction of years did the score for the number of recruits fall within two standard deviations of the mean?
d. What is the median score of the number of recruits?
Fantastic news! We've Found the answer you've been seeking!
Step by Step Answer:
a 55 b 0...View the full answer

Answered By
PALASH JHANWAR
I am a Chartered Accountant with AIR 45 in CA - IPCC. I am a Merit Holder ( B.Com ). The following is my educational details.
PLEASE ACCESS MY RESUME FROM THE FOLLOWING LINK: https://drive.google.com/file/d/1hYR1uch-ff6MRC_cDB07K6VqY9kQ3SFL/view?usp=sharing
3+ Reviews
10+ Question Solved
Related Book For 

The Analysis Of Biological Data
ISBN: 9781319226237
3rd Edition
Authors: Michael C. Whitlock, Dolph Schluter
Question Posted:
