

The following data are the occurrences in 2018 of the different species groups in the list of
Question:
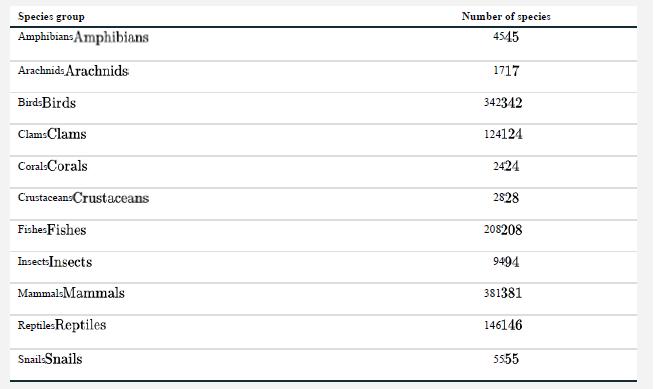
The following data are the occurrences in 2018 of the different species groups in the list of endangered and threatened species under the U.S. Endangered Species Act (U.S. Fish and Wildlife Service 2018). The taxa are listed in alphabetical order in the table. The full data set can be downloaded from whitlockschluter3e.zoology.ubc.ca.
a. Rewrite the table but list the species groups in a more revealing order. Explain your reasons behind the ordering you choose.
b. What kind of table did you construct in part (a)?
c. Choosing the most appropriate graphical method, display the number of species in each species group. What kind of graph did you choose? Why?
d. Should the baseline for the number of species in your graph in part (c) be 0 or 17, the smallest number in the data set? Why?
e. Create a version of this table that shows the relative frequency of endangered species by species group.
Step by Step Answer:
a The following table orders the taxa from those with the m...View the full answer


The Analysis Of Biological Data
ISBN: 9781319226237
3rd Edition
Authors: Michael C. Whitlock, Dolph Schluter
