

The following table lists the ANOVA results for the linear model fit to the data in Practice
Question:
The following table lists the ANOVA results for the linear model fit to the data in Practice Problem 8.
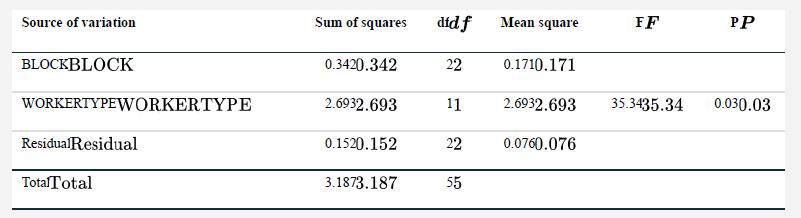
a. Explain in words what the F-ratio for WORKERTYPE measures.
b. Explain in words what the F-ratio for BLOCK measures.
c. The term for BLOCK is not statistically significant. Should it be dropped from the linear model? Explain.
d. Explain in words what the residuals are.
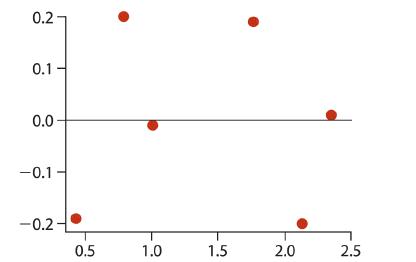
e. Explain what is plotted along each axis in the following residual plot for the bee data.
Data from Practice Problem 8
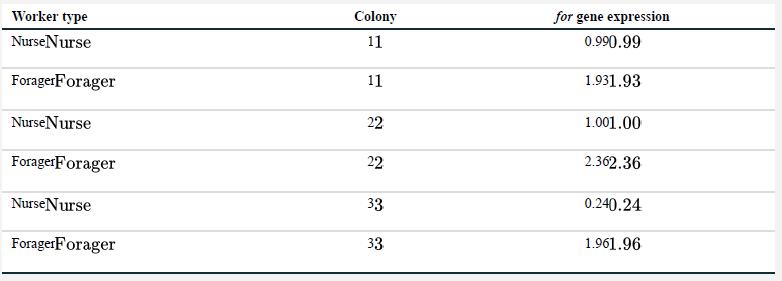
The for gene has been found to underlie variation in foraging behavior in several insect species. Ben-
Shahar et al. (2002) examined whether the gene might influence behavioral differences in the honeybee (Apis mellifera). Worker bees perform tasks in the hive such as brood care (“nursing”) when they are young, but switch to foraging for nectar and pollen outside the hive as they age. The authors compared for gene expression in nurse and foraging worker bees in three bee colonies. The results are compiled in the accompanying table. Gene expression is measured in arbitrary units.
Step by Step Answer:
a It measures whether the full linear model that includes the term WORK...View the full answer


The Analysis Of Biological Data
ISBN: 9781319226237
3rd Edition
Authors: Michael C. Whitlock, Dolph Schluter
