

The following three histograms (A, B, and C) plot information about the number of hours of sleep
Question:
The following three histograms (A, B, and C) plot information about the number of hours of sleep adult Europeans get per night (Roenneberg 2012). One of them shows the frequency distribution of individual values in a random sample. Another shows the distribution of sample means for samples of size 10 taken from the same population. Another
shows the distribution of sample means for samples of size 100.
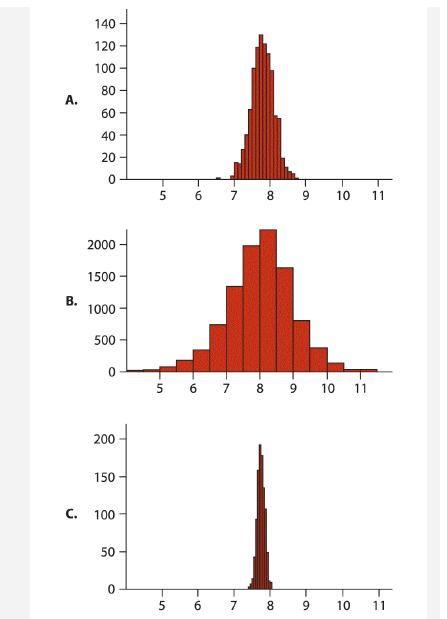
a. Identify which graph goes with which distribution.
b. What features of these distributions allowed you to distinguish which was which?
c. Estimate by eye the approximate population mean of the number of hours of sleep using the distribution for the data.
d. Estimate by eye the approximate mean of the distributions of sample means.
Step by Step Answer:
A Identifying the distributions Individual Values The histogram representing the frequency distribut...View the full answer


The Analysis Of Biological Data
ISBN: 9781319226237
3rd Edition
Authors: Michael C. Whitlock, Dolph Schluter
