

The most common use of the bootstrap in biology is to estimate the uncertainty in trees of
Question:
The most common use of the bootstrap in biology is to estimate the uncertainty in trees of evolutionary relationships (phylogenies) estimated from DNA sequence data. For example, the tree provided for this problem is a phylogeny of the carnivores, a group of mammals, based on their gene sequences (Flynn et al. 2000). The arrangement of branches on the tree indicates how species are related by descent. Pick any two named species on the right (representing the present time) and follow their branches backward in time (to the left) until the branches meet at a node representing their common ancestor. Species are closely related if they share a recent common ancestor. In this tree, for example, the cat is more closely related to the mongoose than either of these two species is to the wolf. The tree is not necessarily the true phylogeny, but an estimate based on the assumption that species sharing a recent common ancestor will have had less time to become different in their DNA sequences than more distantly related species. The bootstrap is used to calculate the uncertainty in the arrangement of the branches of the estimated evolutionary tree. To do this, the bootstrapping procedure resamples the DNA sequence data and recalculates a phylogenetic tree from each new bootstrap sample (we’ll spare you the details). This is repeated a large number of times. The method then examines every bootstrap replicate tree and compares it to the tree estimated from the original data. Every node of the carnivore tree shown here gives a number between 0 and 100 that refers to the percentage of bootstrap replicate trees that have exactly the same set of named species descended from that node. For example, the number 100 on the branch leading to the two skunks means that 100% of the bootstrap replicate trees had a node just like it leading to the same two skunks. The number 54 leading to the trio of red panda (pictured on the first page of this chapter), striped skunk, and spotted skunk indicates that just 54% of the bootstrap replicate trees had a node containing only those same three species. The remaining 46% of the bootstrap replicate trees had different arrangements (e.g., the red panda might have been grouped with the weasel or raccoon).
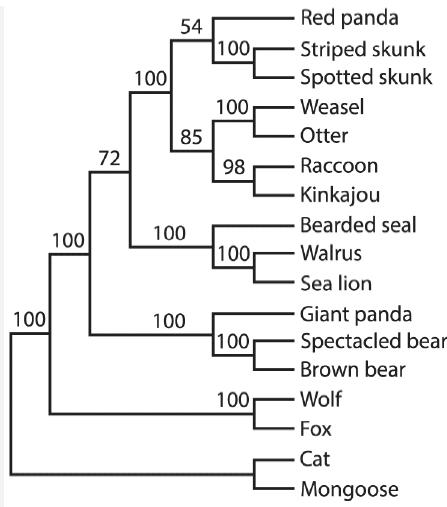
a. What percentage of the bootstrap replicate trees showed the raccoon as the species most closely related to the kinkajou?
b. What percentage of the bootstrap replicate trees grouped the giant panda with the two bear species?
c. From the results of this bootstrap, which of the following statements can be made with greater confidence: that “red pandas are most closely related to skunks” or that “giant pandas are most closely related to bears”?
Step by Step Answer:
a 98 b 100 ...View the full answer


The Analysis Of Biological Data
ISBN: 9781319226237
3rd Edition
Authors: Michael C. Whitlock, Dolph Schluter
