

The following chart shows health expenditures for the United States between 1960 and 2014. Using a spreadsheet
Question:
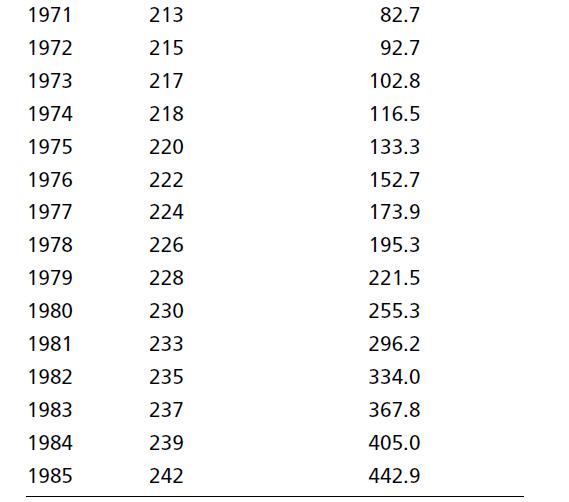
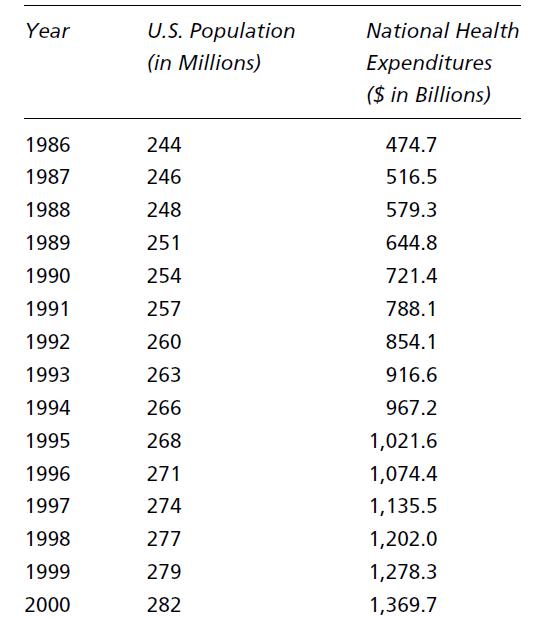
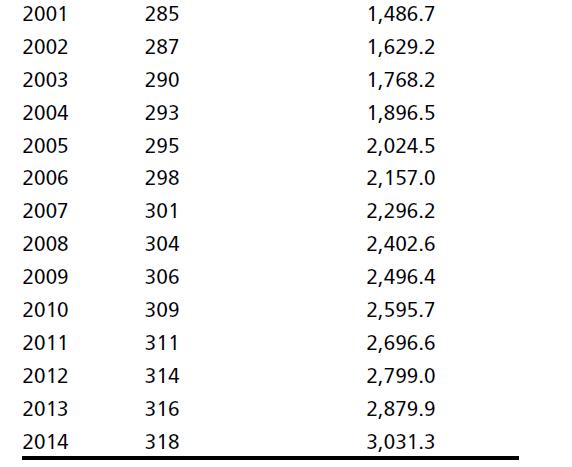
The following chart shows health expenditures for the United States between 1960 and 2014. Using a spreadsheet program:
(a) Calculate health expenditures per person for each year.
(b) Calculate percentage increases in health expenditures per person for each year.
(c) Can you fi nd particular events in given years that might explain either small or large changes in the health expenditures per person or in the percentage changes?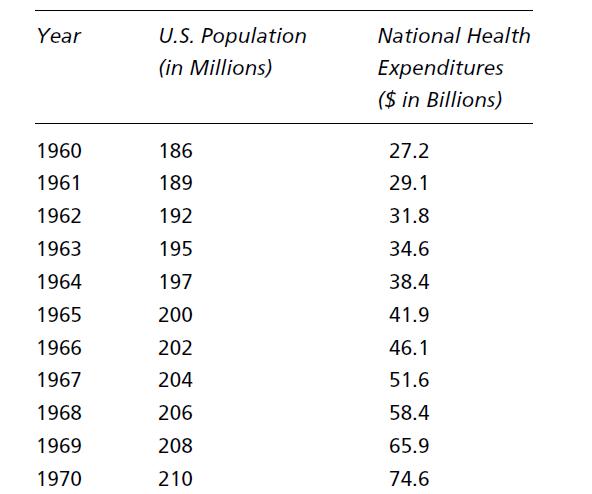
Fantastic news! We've Found the answer you've been seeking!
Step by Step Answer:
To begin with part a of your question Health expenditures per person can be calculated by dividing the National Health Expenditures for each year by t...View the full answer

Answered By
Rayan Gilbert
I have been teaching since I started my graduation 3 years ago. As a student, working as Teacher/PA has been tough but made me learn the needs for student and how to help them resolve their problems efficiently. I feel good to be able to help out students because I'm passionate about teaching. My motto for teaching is to convey the knowledge I have to students in a way that makes them understand it without breaking a sweat.
1+ Reviews
10+ Question Solved
Related Book For 

The Economics Of Health And Health Care
ISBN: 9781138208049
8th Edition
Authors: Sherman Folland, Allen C. Goodman, Miron Stano
Question Posted:
