

Question: Using your computer solution from Problem 8.29, vary the outflow pressure from 100 kPa to 5.0 MPa (no throttle). Plot a Pv diagram for this
Using your computer solution from Problem 8.29, vary the outflow pressure from 100 kPa to 5.0 MPa (no throttle). Plot a P–v diagram for this range of pressures. Compare your results to Figure 7.8.
Solve Problem 8.28 using EES or other software.
Problem 8.28
Air is throttled (in a constant-enthalpy process) across a valve from 5.0 MPa and 300° C to 120 kPa. Determine the temperature and specific volume of the air downstream of the valve. Also determine the air specific entropy change across the valve (kJ/kg · K).
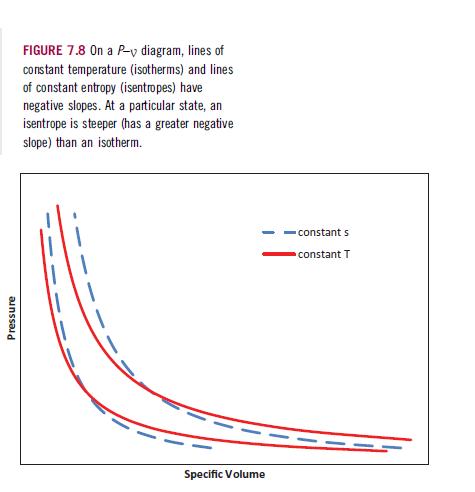
Pressure FIGURE 7.8 On a P-v diagram, lines of constant temperature (isotherms) and lines of constant entropy (isentropes) have negative slopes. At a particular state, an isentrope is steeper (has a greater negative slope) than an isotherm. Specific Volume constant s constant T
Step by Step Solution
3.51 Rating (158 Votes )
There are 3 Steps involved in it
Given Inlet pressure P1 50 MPa Inlet temperature T1 300C Outlet pressure P2 120 kPa To determine Out... View full answer

Get step-by-step solutions from verified subject matter experts