

Question: Selected financial data for two intense competitors in a recent year follow (amounts in millions): Required a. For each company, calculate the following ratios: i.
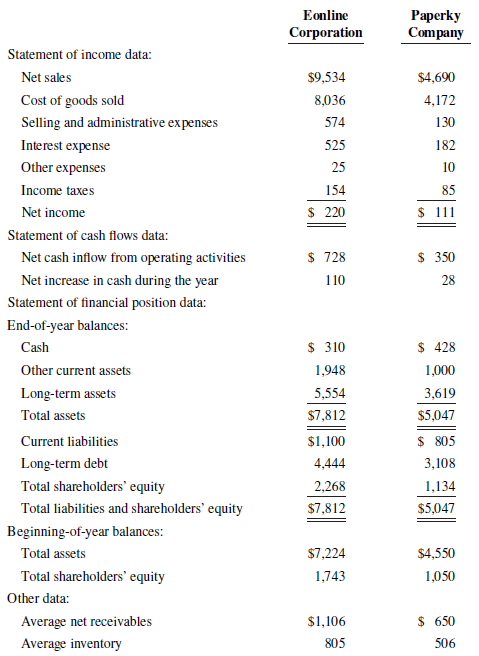
Selected financial data for two intense competitors in a recent year follow (amounts in millions):
Required
a. For each company, calculate the following ratios:
i. Average collection period for receivables
ii. Days to sell inventory
iii. Current ratio
iv. Net debt as a percentage of total capitalization
v. Interest coverage (depreciation expense was $410 for Eonline and $260 for Paperky)
vi. Return on assets
vii. Return on equity
viii. Cash flows to total liabilities
ix. Gross margin
x. Profit margin
b. Compare the financial position and performance of the two companies, and comment on their relative strengths and weaknesses.
Eonline Paperky Company Corporation Statement of income data: $9,534 $4,690 Net sales Cost of goods sold 8,036 4,172 Selling and administrative expenses 574 130 525 Interest expense 182 Other expenses 25 10 Income taxes 154 85 $ 220 $ 11 Net income Statement of cash flows data: $ 728 $ 350 Net cash inflow from operating activities Net increase in cash during the year 110 28 Statement of financial position data: End-of-year balances: $ 310 Cash $ 428 Other current assets 1,948 1,000 5,554 Long-term assets 3,619 Total assets $7,812 $5,047 $1,100 $ 805 Current liabilities Long-term debt 4,444 3,108 Total shareholders' equity 2,268 1,134 $7,812 Total liabilities and shareholders' equity $5,047 Beginning-of-year balances: Total assets $7,224 $4,550 Total shareholders' equity 1,743 1,050 Other data: $ 650 Average net receivables $1,106 Average inventory 805 506
Step by Step Solution
3.25 Rating (163 Votes )
There are 3 Steps involved in it
a Eonline Paperky i Average collection period 423 days 506 days ii Days to sell Inventory 366 days 442 days iii Current ratio 205 177 iv Net debt to t... View full answer

Get step-by-step solutions from verified subject matter experts