

Question: Solve graphically the following LPP: The constraints are shown plotted on the graph in Figure 2.6. Also, iso-profit lines have been graphed. Maximise Subject to
Solve graphically the following LPP:
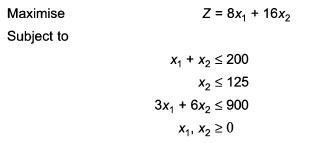
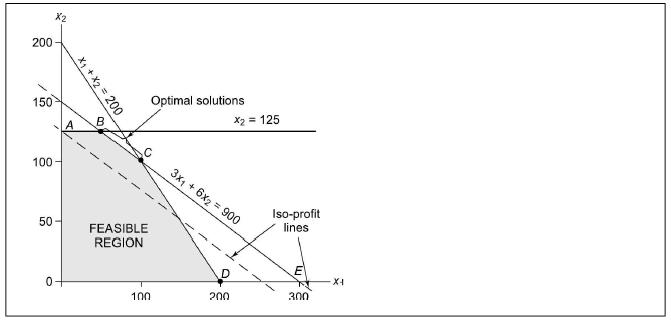
The constraints are shown plotted on the graph in Figure 2.6. Also, iso-profit lines have been graphed.
Maximise Subject to Z = 8x + 16x2 X + X2 200 X2 125 3x + 6x2 900 X1, X220
Step by Step Solution
There are 3 Steps involved in it
1 Expert Approved Answer
Step: 1 Unlock

Question Has Been Solved by an Expert!
Get step-by-step solutions from verified subject matter experts
Step: 2 Unlock
Step: 3 Unlock